
Announcing the next OpenADMET Blind Challenge: Predicting PXR Induction
Introduction
OpenADMET facilitates blind challenges to bridge the gap between computational modeling and experimental reality in drug discovery. By providing high-quality, blinded datasets, these challenges offer a transparent benchmark for evaluating the predictive power of ADMET (Absorption, Distribution, Metabolism, Excretion, and Toxicity) models. We are excited to present our next challenge made possible by our in-house data generation efforts at Octant and structural biology capabilities at UCSF with the Fraser lab.
The next OpenADMET blind challenge focuses on predicting human Pregnane-X Receptor (hPXR) induction. PXR is a nuclear hormone receptor and master regulator of drug-metabolizing enzymes and transporters. Because compounds that induce PXR can derail drug discovery projects by causing adverse interactions, accurate prediction is critical. While PXR induction is traditionally assessed during later-stage lead optimization or ADME profiling, identifying these liabilities earlier in the pipeline can prevent costly late-stage failures. By enabling accurate prediction up front, researchers can prioritize safer candidates and streamline the path to clinical success.
This challenge features two distinct tracks, each with its own leaderboard and structure:
- Activity Prediction: Predicting the pEC50 values for a test set of 513 compounds (split into two stages).
- Structure Prediction: Predicting the bound structures of 110 ligands to PXR.
Background: Why PXR Matters
Evaluating PXR liabilities is a fundamental pillar of aia late-stage ADMET cascade. PXR functions as a xenobiotic sensor, detecting foreign compounds and marshalling drug-metabolising enzymes and transporters by activating their transcription. It primarily regulates CYP3A4, the enzyme responsible for metabolizing approximately 50% of all marketed drugs. Activation of PXR can lead to:
- Drug-Drug Interactions (DDIs): Accelerated metabolism can reduce co-administered drug concentrations to sub-optimal levels.
- Hepatotoxicity: Increased production of reactive, toxic metabolites.
- Chemoresistance: Enhanced clearance of chemotherapeutic agents in tumor cells.
Drug discovery teams face a unique challenge with PXR due to its large, flexible ligand-binding pocket, which accommodates a wide range of chemical structures. PXR is also relatively underrepresented in the literature, with only 800 high-quality pEC50 values from nearly 150 papers in ChEMBL.
The Activity Dataset
Using our data capabilities at Octant, OpenADMET has generated a PXR induction dataset of more than 11,000 compounds using a low-cost, high-fidelity in-house assay. Compounds were sourced primarily from two Enamine libraries (the Discovery Diversity 10 set, and FDA Approved Drugs set), then iteratively expanded with follow-on analogs, with compounds profiled through a rigorous multi-step assay flow reminiscent of an on-target drug discovery program:
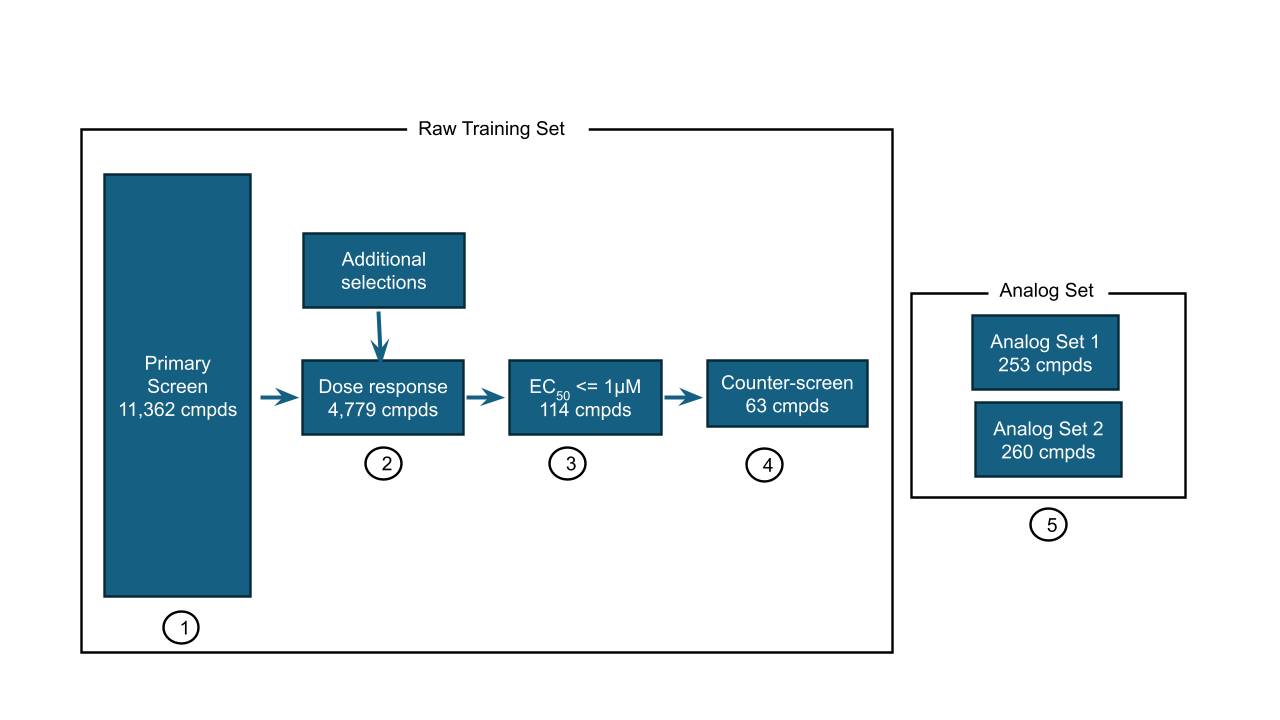
- Primary Screen: 11,362 diverse compounds screened at a single concentration.
- Dose-Response: 4,779 compounds selected for an 8-concentration dose-response. Extensive counter screening in a PXR-null cell line was also conducted to evaluate specificity for PXR.
- Refinement: 114 compounds showed EC50 ≤ 1µM.
- Counter-Screen: We used a PXR-null cell line as a filter, selecting 63 compounds with minimal activity to rule out non-specific effects.
- Analog Expansion: Similarity searches of these 63 activities yielded the 513-compound test set (post final QC) that was ordered from Enamine and assayed.
The design of this challenge mimics a lead optimization scenario, where the focus shifts from broad hit-finding to detailed exploration of Structure-Activity Relationships (SAR). Consequently, this dataset contains detailed SAR and activity cliffs that should prove challenging for predictive models. Cumulatively, this represents the largest publicly available PXR activity dataset available today. In our view, the addition of focused analog expansion significantly differentiates this dataset from other broad screens such as Tox21, making it much more like a realistic drug discovery project. We are very much looking forward to seeing what the community can do with this dataset.
Developing the Assay
The assay we leveraged employs a cell-based reporter system to measure PXR induction. To specifically isolate receptor activation, we utilize a well-established two-part chimeric design (Heering & Merk, 2019, Paguio et al., 2010, Jones et al., 2000, Lehmann et al., 1998). This fusion protein is composed of the ligand-binding domain (LBD) of human PXR attached to a heterologous DNA-binding domain, which acts via a reporter construct containing the corresponding DNA response element upstream of a luciferase gene. This approach offers several advantages over using the native, promiscuous PXR promoter element: it reduces crosstalk, provides superior specificity, and maximizes the signal-to-noise ratio, as the response element can be engineered to drive expression at levels significantly higher than the native promoter.
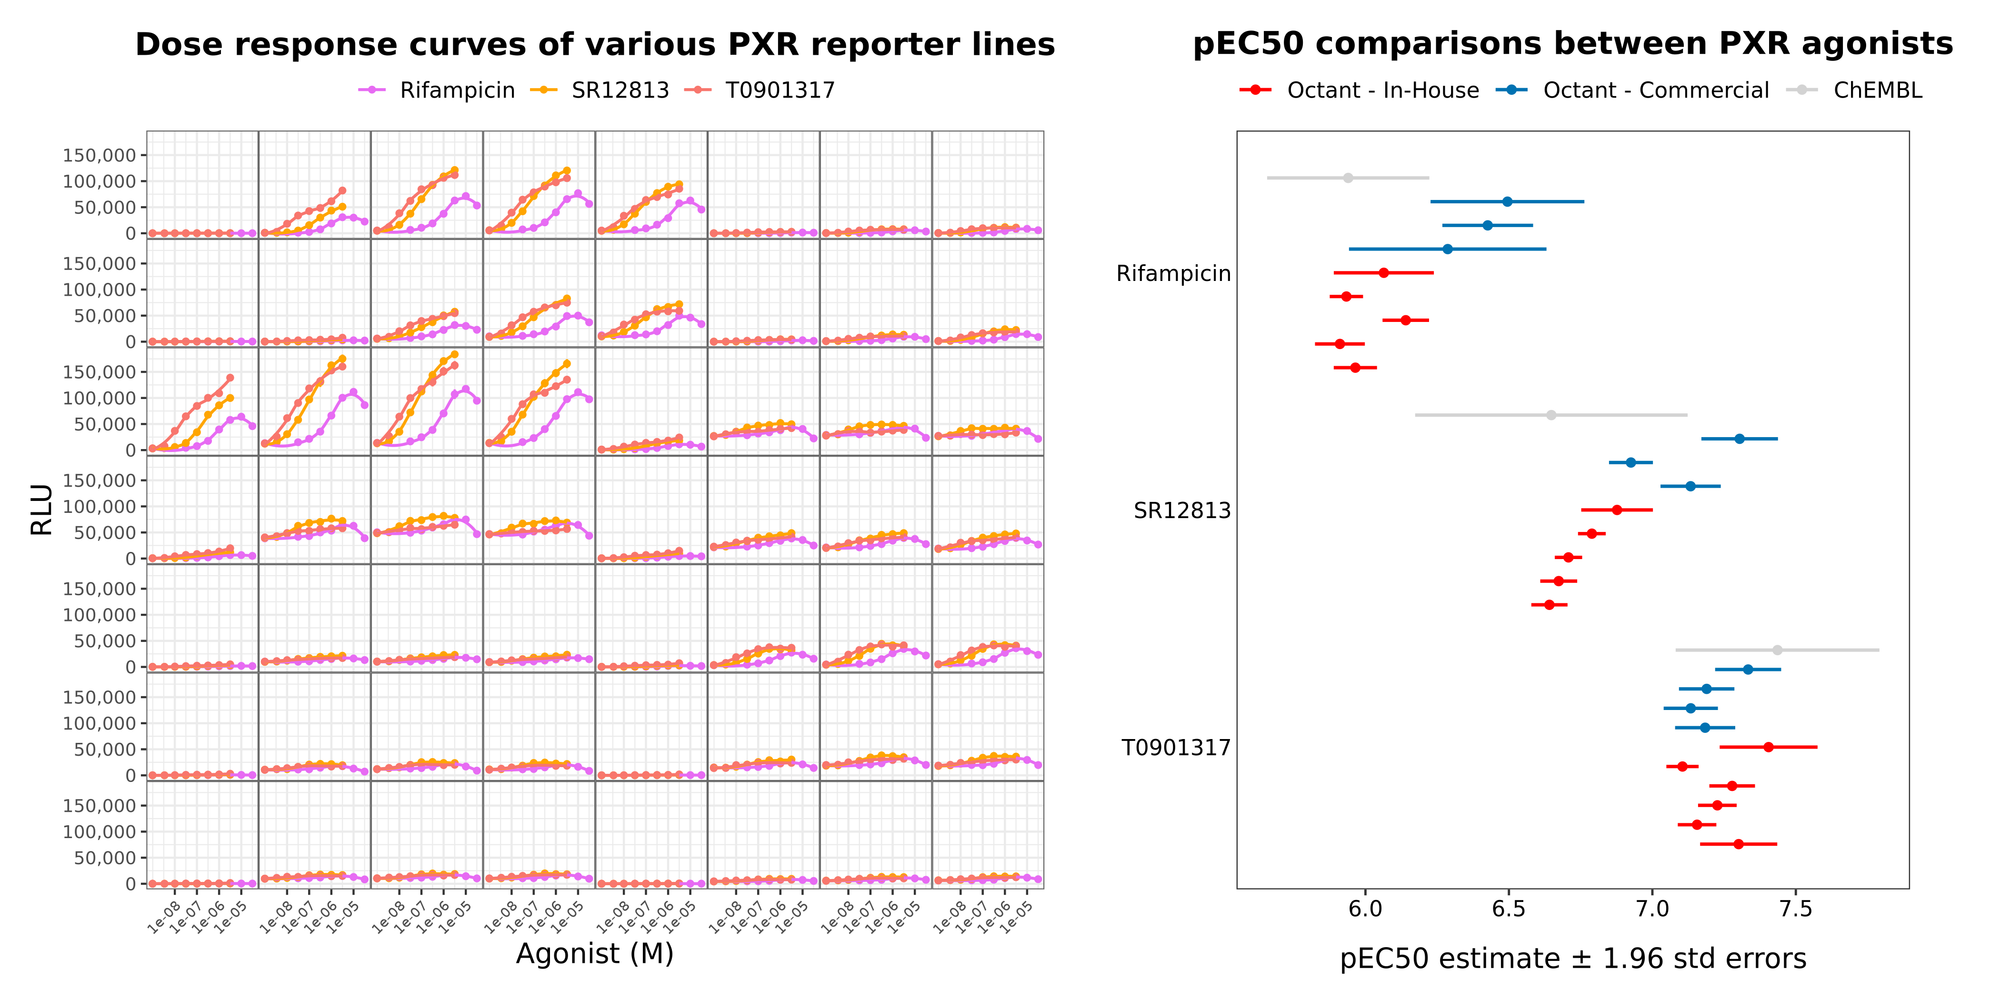
When a test compound acts as an agonist, it binds the PXR-LBD and induces a conformational change. This shift promotes the recruitment of transcriptional activators, driving expression of the luciferase reporter. Because the availability of these regulatory proteins varies across tissues, we evaluated multiple cell lines and tested several genetic constructs (varying the fusion architectures and expression profiles) to maximize the assay's statistical amenability (maximize dynamic range, minimize noise). By testing these cell lines and constructs against a reference set of known compounds, we optimized the system to achieve highly robust and reproducible data that match literature data for reference metrics (e.g. pEC50s). This two-part system is stably integrated into the selected cell line to ensure consistent/controlled reporter activity across screening runs.
To ensure signal specificity and eliminate false positives, we also developed and employed a parallel counter-screen. This counter-assay utilizes an identical cell-based reporter system, but the chimeric gene contains multiple early nonsense mutations that abolish functional protein expression. This step is critical for filtering out compounds that artificially inflate the luminescent signal without actually interacting with PXR. Consequently, we can identify and confidently exclude non-specific upregulators, such as general transcriptional activators or molecules that alter chromatin dynamics (e.g., HDAC inhibitors), from our pool of true PXR agonists. At Octant we have found both that counter-assays of this type to be essential for producing the high-quality data required to train robust ML models and that these assays are broadly lacking in currently available datasets.
How We Constructed the Dataset
As discussed in our previous post, assay design inherently requires balancing tradeoffs between cost, capacity, chemical space coverage, and data completeness. To optimize both throughput and broad chemical space evaluation, we implemented a two-tier screening strategy. This approach begins with an initial primary screen at a limited number of doses, followed by comprehensive dose-response curves (DRCs) and counter-screens for selected hits.
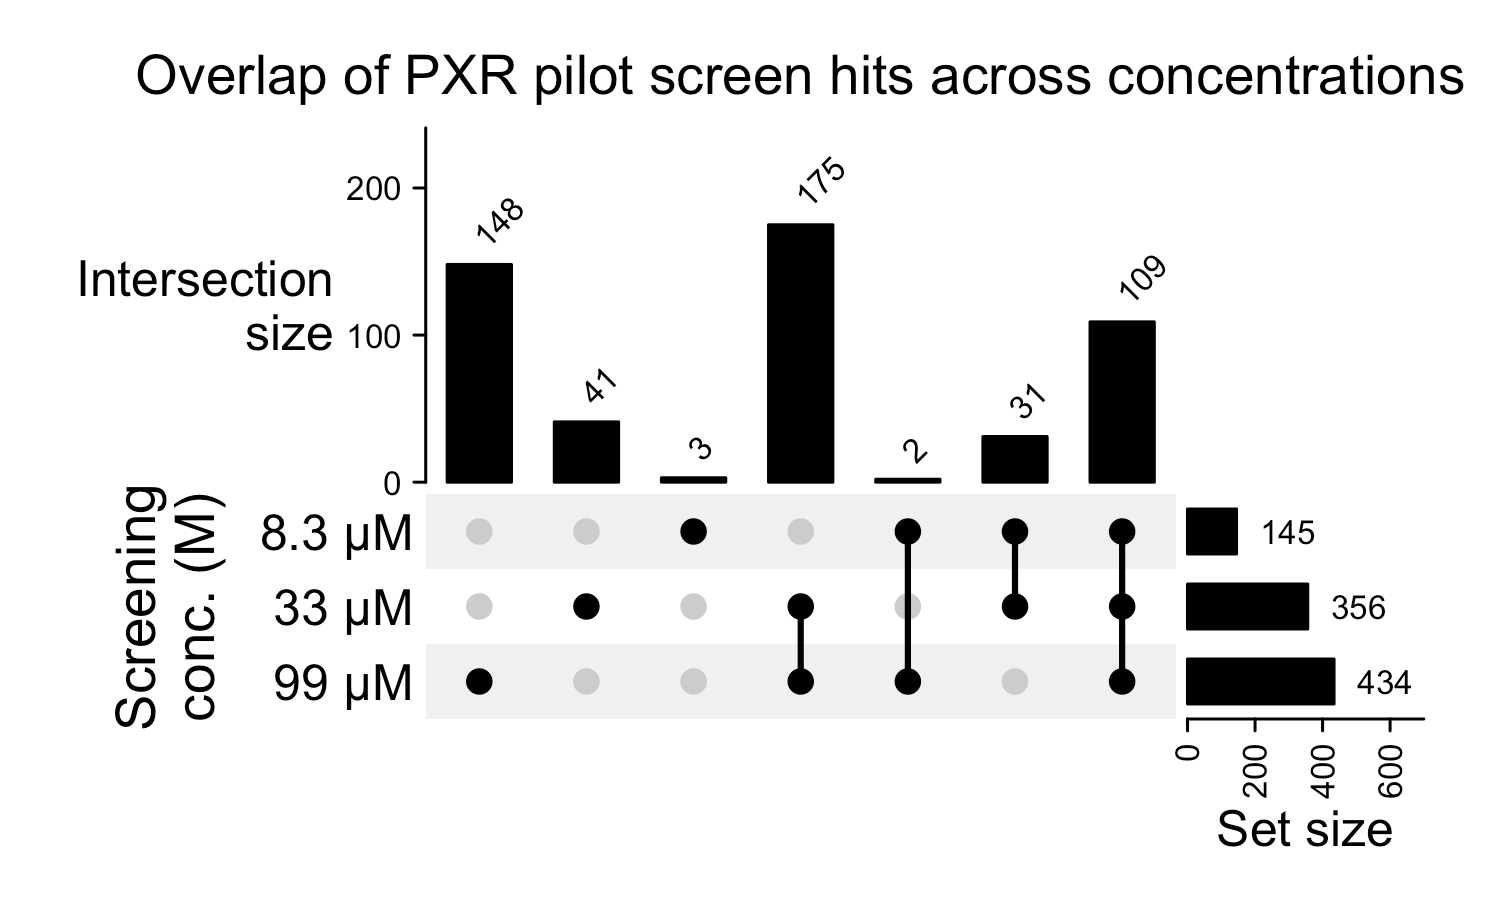
To determine the optimal concentrations for this primary screen, we performed a pilot screen on a representative plate from the chemical deck at 10, 30, and 100 µM. We ultimately selected 10 and 30 µM, as their respective hit rates of ~17% and ~51% were sufficient to yield a robust, manageable set of compounds for follow-up DRCs. Furthermore, prioritizing the lowest possible concentrations that generate acceptable hit rates mitigates widespread solubility issues and biases our focus toward the most potent compounds.
From here, selecting hits to advance to follow-up DRCs is straightforward. For each plate, we fit a linear model on logged data with a fixed effect term for the compound, contrasting against the negative control. This yields an estimated log fold change for each compound relative to the negative control signal. Despite screening in singlicate for each dose, this model assigns standard errors, p-values, and confidence intervals to these estimates based on the noise observed in replicated control conditions. Finally, to account for the thousands of hypotheses tested, we apply the Benjamini-Hochberg method to calculate the false discovery rate (FDR). A compound is formally classified as a hit when its log2 fold change exceeds 1 and its FDR is below 5%.
We then collected 8-point dose-response curves for every compound classified as a hit at the lowest (10 μM) dose in the primary screen. Beyond the primary hits, we also tested two additional sets in dose-response mode: chemically similar analogs from the Enamine decks that were not initially prioritized, and a separate set from an additional diversity library. All of these follow-on compounds are included in the final dataset.
To extract dose-response parameters from the collected data, we performed an initial empirical curve classification followed by Bayesian curve-fitting. In the classification, we determine if a curve shows any activity or “rollover,” a common observation in cell-based assays at high concentrations of compound in which the signal reverts to baseline or decreases to zero (generally either due to insolubility or toxicity, respectively). We then fit a model that captures a compound’s activity and rollover as the product of two 3-parameter models (EC50, Emax, and Hillslope for each), with the EC50 parameters constrained by the initial classification and the mean of the negative controls assigned as the Emin (baseline signal). Other parameter constraints, curve classifications, and best practices for using the data will be provided in an upcoming data release FAQ.
Following evaluation of our DRC dataset, we conducted hit expansion on potent compounds demonstrating on-target PXR activity.. By selecting compounds with EC50 ≤ 1µM (pEC50 of 6) and at least 1.5 log units difference between the pEC50 in the primary assay and counterassay, we identified 63 promising candidates for hit-expansion in the Analog set. We then selected a set of chemisimilars from the Enamine US on-demand catalog that had an ECFP4 Tanimoto similarity > 0.4 to the potent and selective set as analogs, expecting a wide range of activity. DRCs and EC50s were then collected for this set which form the test set. Counter screen data was also collected for the Analog set to evaluate whether activity was on-target. Post processing QC was used to ensure only reliable DRCs were retained. Note that as we have conducted additional QC, train data is slightly smaller than the raw data above (and Figure 3).
Cumulatively this leaves us with a wealth of PXR activity data to train and evaluate our models ensuring both potency, selectivity in a lead-opt like setting.
The Structure Dataset
PXR’s large flexible binding pocket is highly dynamic and is capable of recognising ligands of vastly different sizes and shapes, essential for its role as a xenobiotic sensor. This structural plasticity represents a significant challenge to structure based design methodologies. At OpenADMET we are aiming to create impactful large-scale structural datasets across a variety of anti-targets. To identify new ligands, we use X-ray crystallography to perform a fragment screen, essentially turning structural biology into a primary binding assay. This data resolves binding events for even very weakly bound fragments and provides a map of the pharmacophore recognition potential within the binding pocket. To accomplish this on PXR, we expressed and purified the ligand binding domain of PXR with a co-activator peptide using a construct based on previous apo (PDB 3CTB) and agonist-bound (PDB 3HVL) structures. The construct was modified by insertion of a TEV protease site after the N-terminal His-tag and deletion of an additional 12 residues from the N-terminus.
Fragments from the DSI-poised, Enamine Essential and UCSF libraries were soaked into crystals at UCSF using the previously published P2₁2₁2₁ crystal form at a nominal concentration of 10 mM, with diffraction data collected at NSLS-II using the AMX and FMX beamlines. Data were reduced using Autoproc and electron density maps were analyzed for fragment binding events using PanDDA. Ligands were modeled in COOT using coordinates and restraints generated by phenix.elbow and models were refined with phenix.refine. We are collaborating with Schrödinger on refinement against experimental data to ensure chemical accuracy of both protein and ligand protonation and conformations. They are holding the data in strict confidence and it will not feature into any tool development during the course of the challenge. The entirety of the fragment set will be used as a test set during the challenge, with half used for a live leaderboard and the other remaining fully blinded. In addition, we have re-refined 68 structures from the PDB and generated new coordinate sets that will be available as training data.
Challenge Details
The challenge consists of two tracks, and participants are welcome to enter either or both tracks. Following the model of our previous challenge, the competition will be hosted in a dedicated HuggingFace space. We will be coordinating the challenge through the #pxr-challenge channel on the OpenADMET Discord; use the invite here to join if you haven’t already.
1. Activity Prediction Track
Participants will predict pEC50 values for the 513-compound Analog set. We will provide an extensive data package for the training set, including PXR pEC50 and Emax, null line pEC50 and Emax, and supporting raw data. The SMILES strings for the blinded test set(s) will be provided for participants to make predictions on.
The track proceeds in two phases to simulate the progression of a drug discovery program:
- Phase 1: Participants predict activity for the full set of 513 compounds (Analog Sets 1 and 2). During this stage, Analog Set 1 will be used as a live leaderboard.
- Phase 2: pEC50 values for Analog Set 1 are unblinded, participants may refine their predictions for the remaining compounds in Analog Set 2. To ensure a rigorous final assessment, there will be no live leaderboard for this component: predictions on Analog Set 2 will be fully blinded.
Note that you will only be evaluated on the pEC50s of each respective Analog set without consideration of the counter-assay (PXR-null) data. We viewed determination of on- vs off-target PXR selectivity for the test set as too subjective to be ideal for this challenge format. However, we are interested to see how you utilize the data, and welcome feedback for future challenges on the utility of off-target data. All relevant data will be released after the challenge.
The primary metric used for evaluating submissions in the activity track will be the RAE with respect to the test set. Extensive secondary metrics and error estimation via bootstrapping will be available. Participants should submit their predictions for all 513 compounds (Analog Sets 1 and 2) in CSV or Parquet format, using the OpenADMET ID as the key for each molecule. Automated submission feedback will also be given through a dedicated channel on our Discord server.
2. Structure Prediction Track
Participants are provided with SMILES strings for 110 fragment-sized small molecules (subject to final QC) for which we have determined PXR X-ray crystal structures. Submissions must consist of the predicted protein-ligand complex for each of the 110 ligands, and participants are encouraged to use protein structure prediction tools or existing PDB structures in their workflows. Because fragment binding prediction is a challenging problem, we look forward to seeing what strategies participants come up with. To track progress, there will be a live leaderboard with half of the PXR fragment structures to calculate real-time performance.
The primary metric used to score participants will be Local Difference Test for Protein Ligand Interactions (LDDT-PLI), with other secondary metrics such Binding-Site Superposed, Symmetry-Corrected Pose Root Mean Square Deviation (BiSyRSMD) available alongside error estimation. Participants will need to submit a ZIP file containing their full predicted structure for each protein-ligand complex as PDB files. Submitted PXR structures should be a monomer. Each predicted structure is then evaluated against its reference keyed by the crystal ID using the OpenStructure structure comparison workflow, which conducts automatic matching of predictions against reference structures. Submission feedback will be given automatically in a dedicated discord channel.
Further detailed instructions, FAQs and example submission and validation pipelines will be made available on the day of challenge launch.
The Timeline
| Date | Action |
|---|---|
| March 17 | Challenge announced |
| April 1 | Training and test sets released; SMILES for pose prediction structures released; submissions open [both tracks]. |
| May 25 | Phase 1 concludes [Activity track]; all Phase 1 submissions are due, Intermediate leaderboard for both tracks. |
| May 26 | Analog Set 1 unblinded [Activity track] |
| July 1 | Phase 2 concludes [Activity track]; all Phase 2 submissions are due. Submissions for the structure prediction challenge [Structure track] are due. Challenge closes. |
| After July 1 | Webinars, blog posts and wrap up. |
Acknowledgements
We would like to acknowledge the hard work of all the experimentalists at Octant and UCSF for making this challenge possible. In particular, we would like to thank Sam Sabaat, Scott Simpkins, Yuning Shen, Bryan Jiang, Henry Chan, Jeff Tang, Ayesha Ghazali, Theo Tarver, Steven Edgar, Dominic Ky, and many others from Octant and Galen Correy, Nikhil Gupta, and others from the Fraser lab at UCSF. We also thank the beamline staff at NSLS-II.