
OpenADMET's Inaugural Model Release
Authors: Devany West, Ph. D., Software Scientist, and Cynthia Xu, Research Software Engineer
OpenADMET’s mission is to develop ADMET models for drug discovery
Drug discovery is a risky venture: it is estimated that nearly 30% of all drug candidates fail due to safety concerns, and as many as 20% fail due to poor pharmacokinetics. At OpenADMET, we aim to leverage assay and structural data to build the next generation of ADMET models for small molecule drug discovery through open science, open datasets, and mechanistic interrogation of ADMET properties. As our effort progresses, we aim to create increasingly robust models (e.g. via active learning) as we accumulate and incorporate new compound data and scale new assays. In order to quantify performance improvements, it is important to first establish a baseline. To do this, we will first train a suite of models–both traditional tree-based machine learning (ML) methods and state-of-the-art deep learning architectures–with no fine-tuning on publicly available data from the ChEMBL database. Here we present the results for two prototypical ADMET properties: CYP3A4 inhibition and CYP induction via the PXR nuclear receptor.
We chose CYP3A4 and PXR as our antitargets for our baseline models
Cytochrome P450s (CYPs) are key metabolizers of foreign compounds. CYP3A4 is the most abundant of the subfamilies of this enzyme class, interacting with an estimated 50% of all known drugs. CYPs are a known cause of drug-drug interaction issues: CYP inhibitors can inhibit drug metabolism, which can increase plasma concentration of the “victim” drug. Screening for CYP inhibition is a routine part of most tiered ADMET assay cascades, and the FDA requires rigorous CYP inhibition testing before pharma companies are permitted to submit a new drug application.
Given the enzyme’s importance, the fact that it is relatively easy to assay, and conducive to high-throughput screening means there is a reasonable amount of CYP3A4 data available in ChEMBL, at least when compared to other targets. This inhibition is typically reported as a pIC50, the log of the half-maximal concentration required to inhibit enzyme activity by 50%. In ChEMBL, these values are reported as pChEMBL values, which are log concentrations aggregated over different reported data types (see here for more details on pChEMBL values). We chose a very simple strategy for curation, using only datapoints assigned a pChEMBL value that correspond to an IC50. After applying our curation strategy, we obtained 4800 datapoints for CYP3A4, which can be found here.
In addition to CYP3A4, there are altogether 2-3 thousand datapoints for other CYP subfamilies, including CYP1A2, CYP2D6, and CYP2C9. This additional data allows us to determine if a model trained on data from multiple targets (multitask) provides improved performance compared to 3A4 alone (as has been observed across studies for graph neural networks). However, it should be noted that these datasets in particular are an order of magnitude smaller than those available at some large pharma companies.
We also model PXR, a nuclear receptor that is responsible for controlling the transcription of cytochrome P450s. Drugs that bind to PXR can induce downstream CYP expression, which in turn drastically reduces the plasma concentration of CYP metabolized drugs. This can render these drugs ineffective. As with CYP inhibition, the FDA also requires rigorous testing for CYP induction and nuclear receptor binding. PXR-mediated CYP induction can be measured with a pEC50, or the negative log of the concentration required to reach 50% of the maximal signal on a downstream reporter of activation. This measurement can be taken by using gene engineering to add a fluorescent reporter downstream of a PXR-targeted DNA response element. PXR is less represented in ChEMBL, with only 600 datapoints after our pChEMBL curation, which can be found here. PXR is not as commonly tested in the upper tiers of an ADMET cascade, but it still represents a frustrating cause of development failure (e.g. this program from the Covid Moonshot and DNDI). Making compound screening easier and less expensive with robust computational models would be a major help. Thus, it is an early focus at OpenADMET.
As discussed in Landrum et al 2024, combining publicly available activity values can be a source of significant noise. We did not attempt a detailed curation from primary sources, as we do not expect this to be economical given the number of datapoints, especially when compared to the scale achievable with upcoming in-house data generation at Octant Bio. We did not include additional datasets from outside ChEMBL for the same reason. In early 2026, we will receive our first large-scale PXR activation datasets generated at Octant, which we expect to be far more robust to noise and much larger in quantity. Prior to this, our first pass is intended only to establish a baseline for model performance.
We used our OpenADMET anvil infrastructure to train our suite of models
At OpenADMET, we have developed infrastructure to train models rapidly and at scale. We call this infrastructure anvil, and the codebase can be found here. Broadly, anvil is built to set up and train models from a single-source YAML file, which allows us to train reproducibly and conduct inference easily through a unified interface. Documentation of all available parameters can be found here and a series of demos can be found here. A live version is deployed here. We have selected a variety of architectures from the literature to include in anvil, which we generally divide into two main categories: traditional ML and deep learning. Traditional ML models include architectures such as gradient boosted models and random forest models. We trained our traditional ML models on molecules featurized into two-dimensional fingerprints, chemical descriptors, or a concatenation of the two. There is a nearly endless universe of featurization schemes available for these models, but we have restricted ourselves to the above primarily as they represent standard practice. Deep learning models include graph neural network-based architectures such as ChemProp, which uses learned molecular representations, as initially described in Yang et al. 2019. We used our full suite of model architectures and featurizers to train this initial batch of models. From here, we needed to compare model performance across parameter sets.
We used ‘practical methods’ to compare performance across architectures
To compare model performance, we followed the protocols outlined in Ash et al 2024, which provides a set of statistical practices to follow according to our dataset size and parametric assumptions. We have incorporated these practices into our codebase, which can be accessed via the CLI through the compare command as described here. In our case, we perform 5x5-foldcross cross-validation with two different splitting techniques: random splitting and cluster splitting. This cross-validation gives us 25 independently sampled sets from our distribution, allowing us to resample our data in a way that is statistically significant. The random splitting strategy will give us cross-validation samples that are approximately uniform in their chemical space coverage, whereas cluster splitting (for which we use the Taylor-Butina method) will systematically leave out sections of chemical space. In practice, the random splitting strategy is more representative of what would happen when applying our models to compounds from lead optimization, where chemical space is more likely to be shared among the dataset. Conversely, the cluster splitting strategy is more representative of a situation where our models’ ability to generalize based on incomplete chemical space information is critical, such as when screening vendor libraries, or when designing a novel series. After splitting and cross-validation, we use a repeated measures ANOVA to account for the repetition of our tests and report the mean absolute error (MAE) and the R2 as our primary performance metrics.
The comparison results show that architecture choice had a minimal impact on model performance
Below are our results. The models are specified along the y-axis in the form “model-featurizer” for PXR and “model-featurizer-tasks.” The featurizers are either ECFP:4 fingerprints, 2d chemical descriptors from molfeat, or ChemProp featurizers. For CYP3A4 “ST” denotes “single task” models and “MT” denotes multitask models trained on all CYP data. The best performing model is marked in blue, with statistically equivalent models to the top performer in grey, and models statistically worse than the top performer in red.
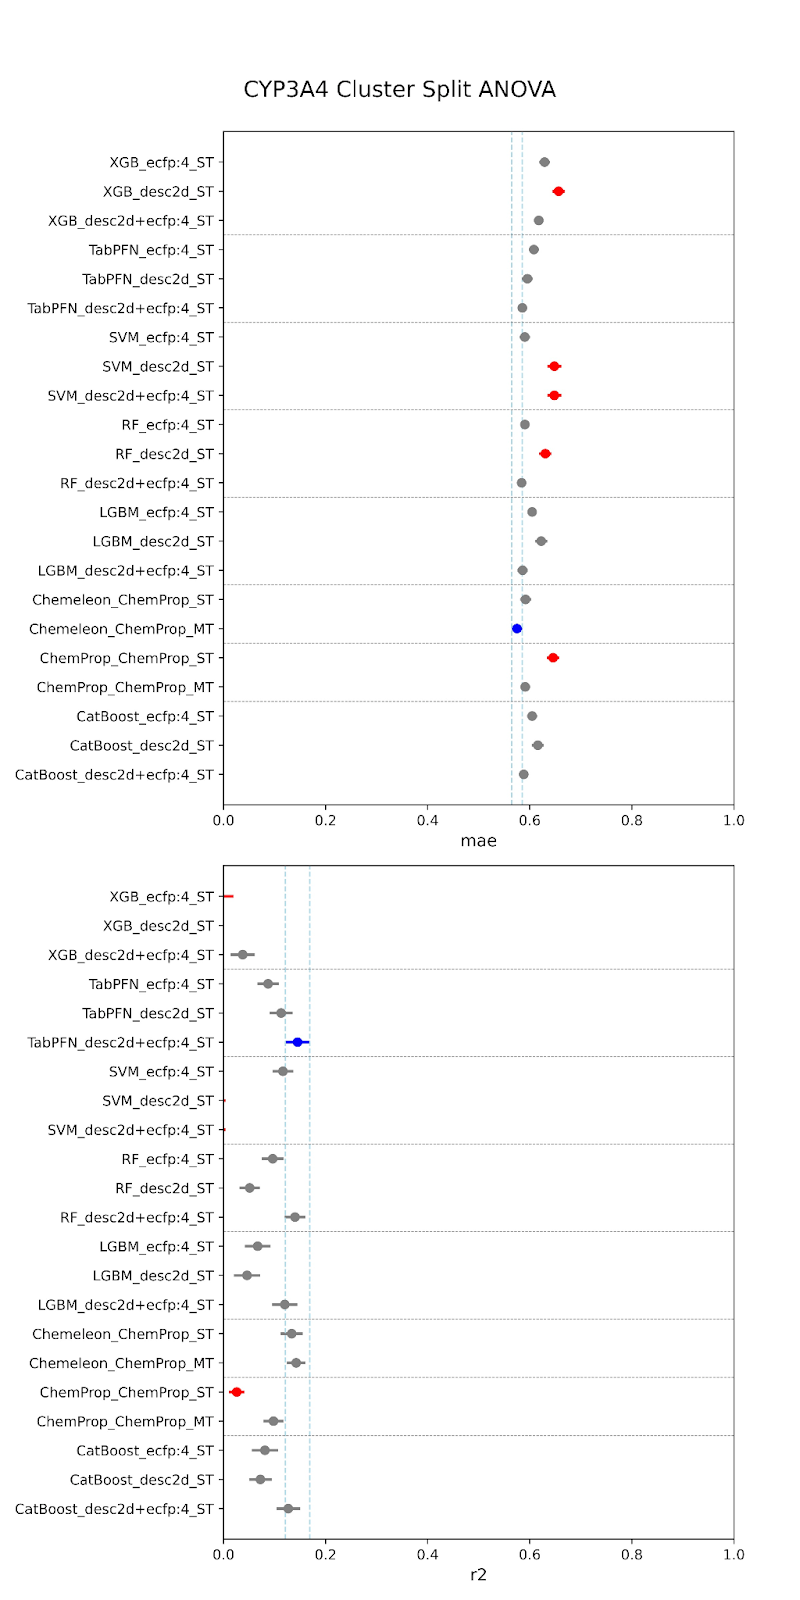
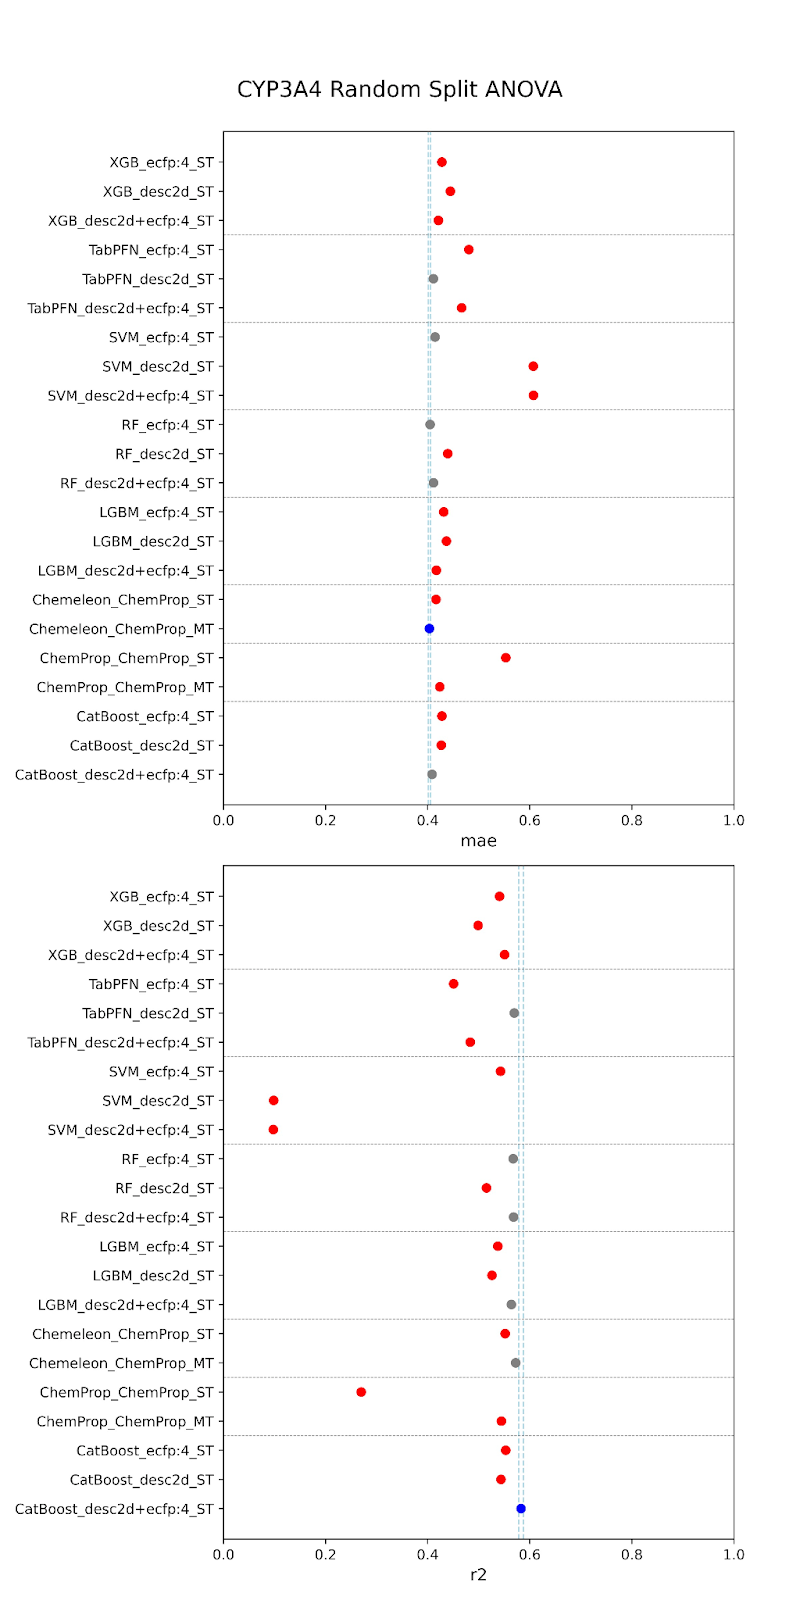
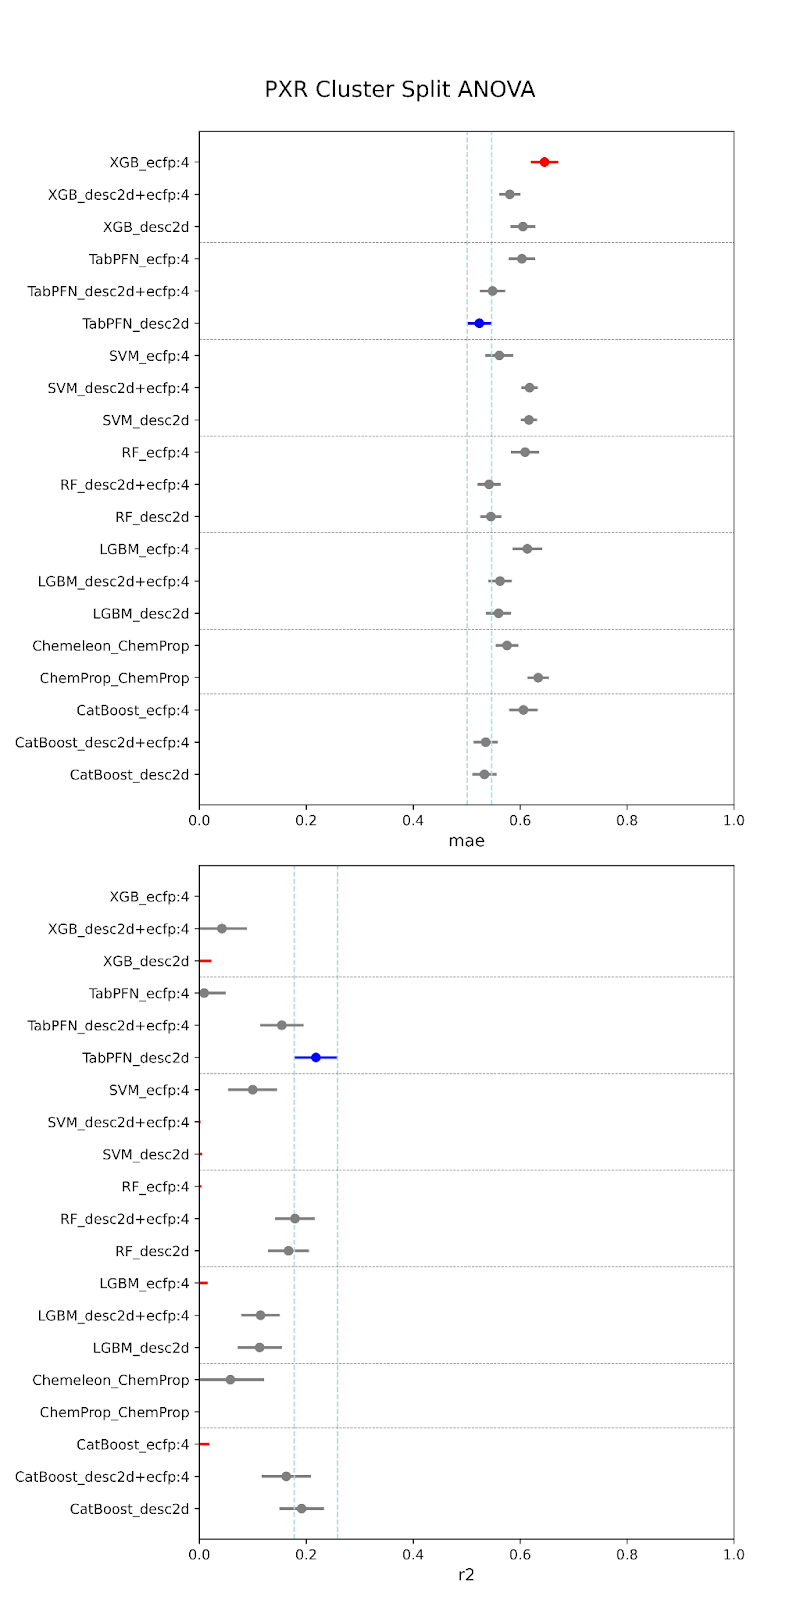
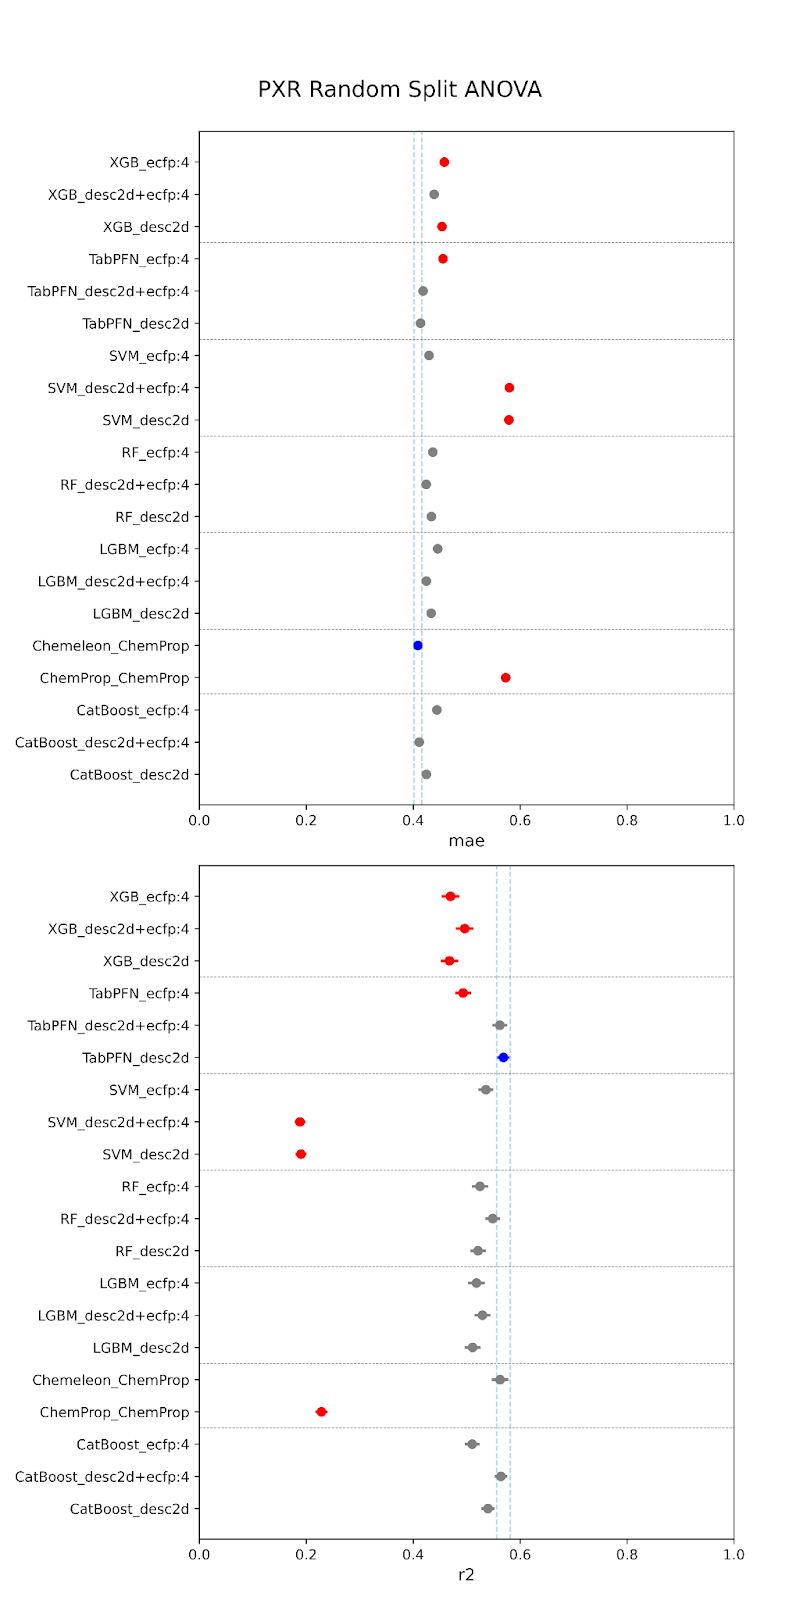
When comparing performance between random and cluster splitting, we saw much better performance with random splitting (with high R2 values ~0.6) than with cluster splitting (with high R2 values ~0.1). This tells us that our models at this stage have difficulty generalizing when shown an out-of-distribution sample, i.e. they will struggle when tested on unfamiliar chemical space. This was expected, given the constraints of our data–we are working with a relatively small amount of public data that likely suffers from high inter-assay noise, as we have discussed. The difficulty in building such models is part of the reason that the OpenADMET project was started! This initial set of models provides us a useful baseline moving forward. It is of critical importance to understand how well predictive models generalize to molecules outside of their known chemical space, especially, as discussed, when working with novel series or screens. If we are able to achieve performance above this baseline after rounds of active learning and the addition of data from Octant, this will represent a significant increase in what is possible for publicly-available ADMET models.
For both random and cluster splitting, we saw a few similar architectures achieving slightly better prediction. These top performers also held for both CYP and PXR models. We found that TabPFN models with descriptors or combination featurizers, and the CheMeleon model (a pretrained version of ChemProp), were among our most consistent top performers. This makes sense, as both are foundation models, and therefore have some pre-trained understanding of the learned space beyond our training. However, despite small increases provided by these architectures, overall we did not find that model performance was significantly impacted by architecture. In fact, there was also no large performance increase from traditional to deep learning models. This is to be expected at this stage. We are currently data-limited, as we’ve previously discussed, and so we wouldn’t expect particular architectures to provide particularly stronger performance.
As no single model was a clear “best performer”, our initial release will consist of one of the stronger candidates. We choose to release the multitask CYP3A4 CheMeleon model, as this model shows a slight performance boost over single-task models, likely due to the increased size of the training set. For PXR, we choose to release our CheMeleon model as well. These results are promising for this stage, as well as consistent with current literature. We anticipate that performance will continue to improve as we integrate larger, higher-quality datasets.
If you would like to test out this model for yourself, please continue to the following section!
How to use OpenADMET models
For easy utilization of OpenADMET’s models on HuggingFace, we highly recommend installing OpenADMET’s Anvil framework. Follow the installation instructions here to create a conda environment called openadmet-models and install the openadmet package. You will also need git lfs installed.
We have two deployed baseline models, one multitask model for CYP inhibition and one single task model for PXR enzymatic activity. Here, we will show you how to download and use the CYP inhibition model.
To download the model, clone the model repo:
git clone https://huggingface.co/openadmet/cyp1a2-cyp2d6-cyp3a4-cyp3c9-chemeleon-baseline/
Change to the repo directory and get the larger model files with git lfs:
git lfs install
git lfs pull
With the openadmet-models environment activated, we can now do some inference with the model.
Alternatively you can use Docker to quickly spin up a containerized pre-installed environment for running openadmet-models, with the model mounted.
docker run -it --user=root --rm -v ./cyp1a2-cyp2d6-cyp3a4-cyp3c9-chemeleon-baseline:/home/mambauser/model:rw --runtime=nvidia --gpus all ghcr.io/openadmet/openadmet-models:main
When performing model inference, we use a trained model to make predictions on new data. Practically speaking, inference is likely the most important step for those working in drug discovery: it is when we use our best-performing model to predict the activity of a set of new compounds.
This is where having a trained ADMET model is extremely useful. In an ideal scenario, with just the SMILES strings of those 100,000 compounds, we can use our model as a screening tool to filter out the compounds that are predicted to be active against CYPs without ever having to set foot in a lab.
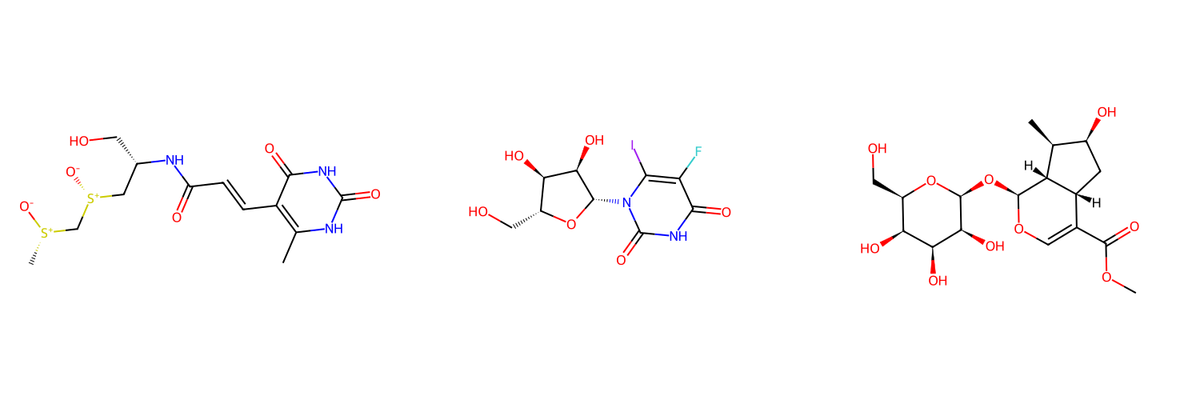
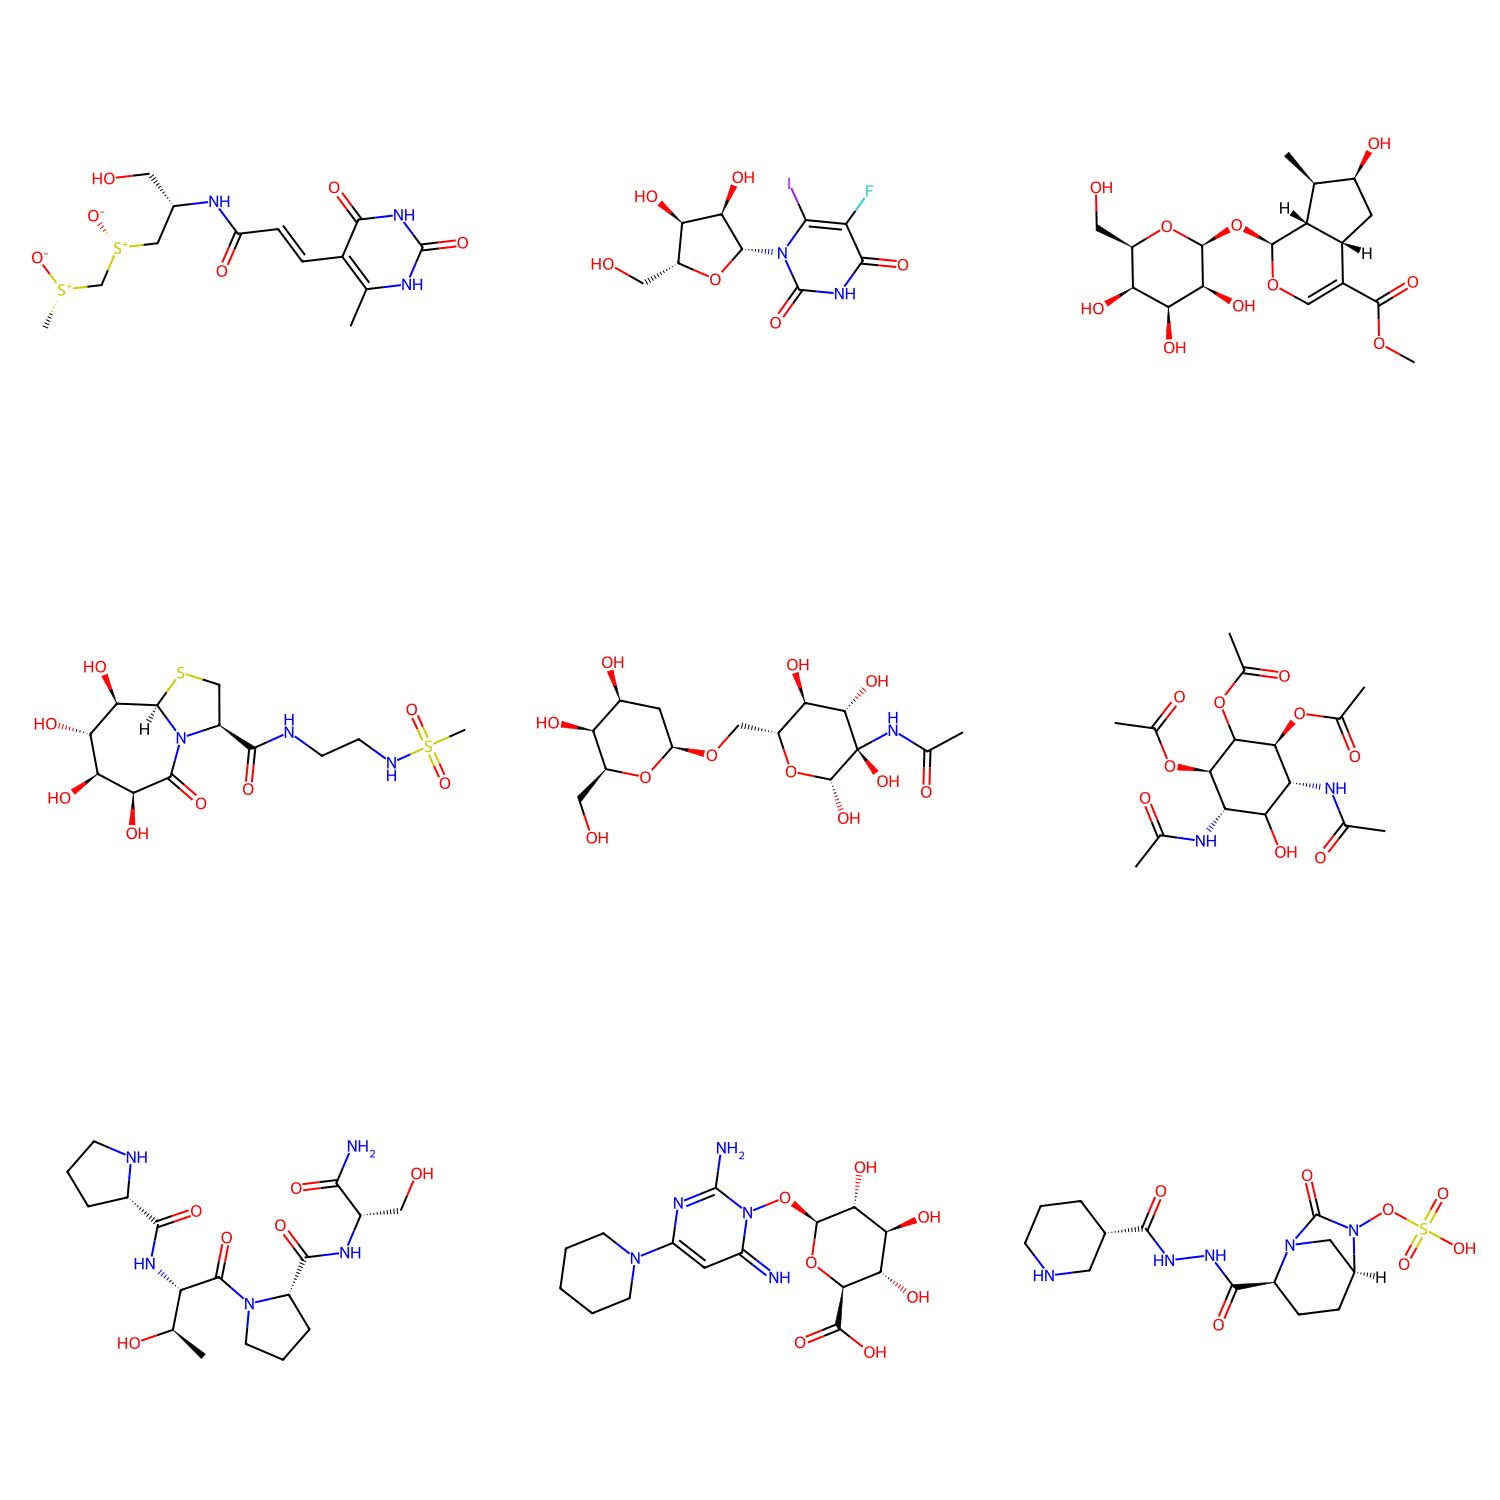
In this example, we have sampled a small subset of 10,000 compounds from the ZINC database in the file compounds_for_inference.csv that we are interested in screening. Some of the molecular structures of these compounds are shown below:
With the anvil framework, inference is as simple as running a single command:
openadmet predict \
    --input-path <the path to the data to predict on> \
    --input-col <the column to of the data to predict on, often SMILES> \
    --model-dir <the anvil_training directory of the model to predict with> \
    --output-csv <the path to an output CSV to save the predictions to> \
    --accelerator <whether to use gpu or cpu, defaults to gpu>
Where you provide the file of compounds you want to predict on, the name of the column containing the SMILES strings, and the folder containing the outputs from the anvil training pipeline. The output is a .csv file with all the predicted pIC50 values.
Here, the command is:
openadmet predict \
    --input-path compounds_for_inference.csv \
    --input-col OPENADMET_CANONICAL_SMILES \
    --model-dir anvil_training/ \
    --output-csv predictions.csv \
    --accelerator cpu
This outputs a file called predictions.csv which will have the predicted pIC50 values (contained in all the OADMET_PRED columns) for each compound for each CYP target.
'OADMET_PRED_openadmet-AC50_OPENADMET_LOGAC50_cyp3a4',
'OADMET_STD_openadmet-AC50_OPENADMET_LOGAC50_cyp3a4',
'OADMET_PRED_openadmet-AC50_OPENADMET_LOGAC50_cyp2d6',
'OADMET_STD_openadmet-AC50_OPENADMET_LOGAC50_cyp2d6',
'OADMET_PRED_openadmet-AC50_OPENADMET_LOGAC50_cyp2c9',
'OADMET_STD_openadmet-AC50_OPENADMET_LOGAC50_cyp2c9',
'OADMET_PRED_openadmet-AC50_OPENADMET_LOGAC50_cyp1a2',
'OADMET_STD_openadmet-AC50_OPENADMET_LOGAC50_cyp1a2'
NOTE: In this example, the standard deviation (OADMET_STD) columns are empty because uncertainty cannot be estimated unless training an ensemble of models. For further details, visit our docs.
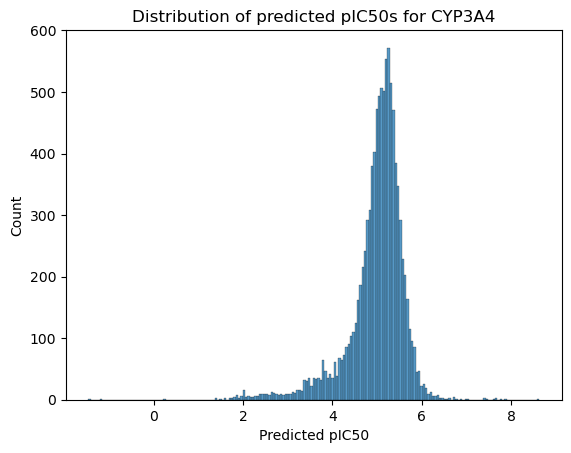
You can now do whatever exploratory data analysis you like to examine and filter the compounds based on these predictions.
import pandas as pd
import matplotlib.pyplot as plt
import seabron as sns
predict = pd.read_csv("predictions.csv")
plt.figure()
sns.histplot(data=predict, x='OADMET_PRED_openadmet-AC50_OPENADMET_LOGAC50_cyp3a4')
plt.xlabel("Predicted pIC50")
plt.title("Distribution of predicted pIC50s for CYP3A4")
We are early in our model-building journey - join us!
Our first, multitask CheMeleon model only represents the baseline performance we hope to achieve. Through successive iterations of active learning with Octant, we hope to improve our performance in an open way that encourages collaboration with the community. Check out our documentation, demos, and our currently open blind challenge if you’d like to be involved. We look forward to hearing from you!