When Experiment and Computation Disagree: Lessons from pKa and logP
Neither a titration curve nor a prediction tells the whole story. With Octant and Schrödinger, we profiled 700+ molecules. Disagreement often pointed to tautomerism, reactive groups, or assay blind spots. Understanding uncertainty can matter more than collecting more data.
Authors: Terry Lou, Art Bochevarov, Ed Harder
The dataset discussed in this blog post is located here. Please feel free to check it out and model with it!
Introduction
In drug discovery, physicochemical properties such as pKa and logP are among the most fundamental descriptors of small molecules. pKa describes the pH-dependent equilibrium between protonation states that differ by a single proton,1,2 while logP describes how a neutral compound partitions between aqueous and organic phases and is widely used as a measure of lipophilicity.3,4 Together, they provide early insight into a compound’s experimental behavior and help set expectations for solubility, membrane permeability, and broader ADME properties.
Because these properties are often considered before a compound is synthesized, early-stage design and prioritization rely heavily on prediction. Chemists build intuition from familiar functional groups, literature precedent, and canonical references such as the Evans and Bordwell pKa tables,5–7 while computational methods model these properties at scale. pKa prediction has become increasingly sophisticated; for example, Modern pKa workflows consider the protonation and tautomeric states that underline predicted macroscopic pKa values, while calculated logP, or clogP, is routinely used to estimate lipophilicity during molecular design.
This raises a more strategic question: Where do physicochemical predictions become uncertain, and what can the source of disagreement between experiment and prediction teach us about those boundaries? Rather than treating disagreement simply as model error or experimental noise, we were interested in understanding what drives it – the underlying chemistry, the limitations of the experimental method, data interpretation, or the assumptions and domain of the computational model.
Through the OpenADMET–Schrödinger collaboration, we explored this question from two complementary perspectives. For pKa, we focused on the molecular features and protonation or tautomeric behavior that make prediction and experimental interpretation challenging, such as electron-deficient heteroaromatics that might exhibit dearomatizing tautomerism. For logP, we examined where existing lipophilicity and free-energy models begin to lose predictive confidence when extrapolated into less-explored chemical space, e.g. small highly lipophilic heterocycles, and how the physical limitations of the experiment itself affect what can be learned from those discrepancies.
pKa: The methodology is an inference problem, not merely an instrument readout
Methodology
At first glance, pKa seems like a straightforward experimental property: titrate a compound and report a number. In this study, we used Pion’s SiriusT3, an automated system for measuring hundreds of samples.8 In practice, the instrument does not observe pKa directly. There are two modes on the SiriusT3 to measure pKa: (i) a potentiometric (a.k.a. pH-metric) experiment observes a titration response in triplicate, and (ii) a UV-metric experiment observes changes in spectra as a function of pH. Methanol is added as a co-solvent prior to the titrations to facilitate the solubilization of the small molecules of interest, and the aqueous pKas are inferred by extrapolating measurements made at different methanol-to-water ratios using the Yasuda-Shedlovsky extrapolation.9–11 The reported pKa is therefore the end of an interpretation process rather than a direct instrument readout.
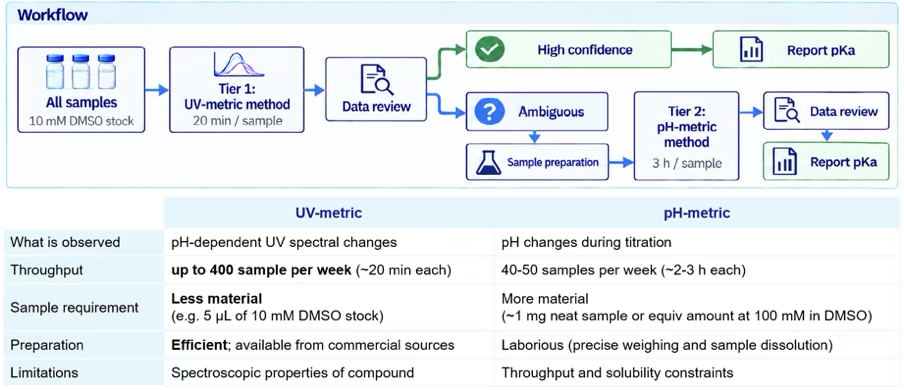
To balance experimental throughput and dataset quality, we adopted a two-tier strategy: samples were first screened using the faster UV-metric method, with lower-confidence measurements promoted to potentiometric confirmation. While the potentiometric method is the canonical approach for pKa measurement,9,10 its throughput is limited due to longer run time for each sample and it is a more laborious process. Neat samples or highly concentrated DMSO stock solutions are required which can introduce solubility constraints. In contrast, the UV-metric method enables substantially faster measurement, allowing more samples to be tested. It only requires microliters of 10 mM DMSO stock, making it more compatible with high-throughput drug-discovery workflows as compounds are typically solubilized, and tested, at 10 mM in DMSO. In turn, its main limitation is that reliable pKa assignment depends on the compound having sufficient UV absorbance and, on protonation, producing a measurable change in its spectrum.
Data analysis
Upon completion of the measurements, the data were processed using “SiriusT3Refine”, Pion’s native data-analysis software. In the “Design” settings, the user specifies parameters such as the expected “number of pKas”. SiriusT3Refine then applies the corresponding fitting model to the titration data and reports the user-defined number of pKa transitions.
In the dataset shared alongside this blog post, we report the unassigned SiriusT3Refine output obtained by fitting each measurement with 1-, 2-, 3-, and 4-pKa models, without preselecting a preferred interpretation. However, choosing the most appropriate model, and thus obtaining a chemically meaningful pKa assignment, requires an informed estimate of how many protonation transitions are expected within the experimentally accessible range.
In our analysis, we deployed Schrödinger’s Macro-pKa workflow,12,13 which combines quantum-chemical calculations with machine-learning corrections, to predict the protonation transitions expected within the experimental titration range of pH 2–12. We then used those predictions to inform the fitting model selected in SiriusT3 Refine. This provided an additional layer of chemical context when multiple fitting models appeared mathematically plausible. The fitting could also be further evaluated through manual review and processing on SiriusT3Refine. For example, turbidity was occasionally reported when compounds crashed out during the titration, or noisy responses were observed due to low solubility or absorbance. In such cases, restricting the analysis to the experimentally informative pH range could improve the quality and interpretability of the fit, provided that the excluded region could be justified by the experimental observations.
Reported pKa value is an inference from an interpretation pipeline
Raw instrument readouts often require additional review and interpretation before we can establish confidence in the reported pKa values. This process is essential not only for understanding outliers and distilling broader learnings from the dataset, but also for generating data that can meaningfully inform computational models. That need became especially apparent as we reviewed a deliberately diverse set of over 700 molecules, including tautomerizable compounds with uncertain equilibria and heterocycles with sparse literature precedent – chemical space in which predictive models are often less certain. In this context, the reported pKa values should be viewed as the endpoints of a series of measurements, modeling, and data-interpretation steps. The relationship between experimental and computational pKa values is therefore too nuanced to be captured by simply placing all 719 molecules on a single scatter plot. A global metric, such as the mean unsigned error across the entire test set, can summarize overall agreement, but it cannot explain why individual discrepancies arise.
A disagreement between experiment and prediction can arise for several distinct reasons, and determining which applies often requires examining the molecule and its underlying protonation equilibria individually.
The comparison below illustrates the impact of this interpretation step. The automated workflow – which incorporated Macro-pKa predictions to guide curve modeling in SiriusT3Refine – already captured much of the overall trend, while chemically informed review of the experimental fits further improved the consistency of the assignments. Importantly, the objective was not simply to move every point toward the diagonal. It was to make the remaining off-diagonal points more trustworthy so that they are more likely to reflect meaningful chemistry, experimental limitations, or modeling assumptions that warrant closer examination.
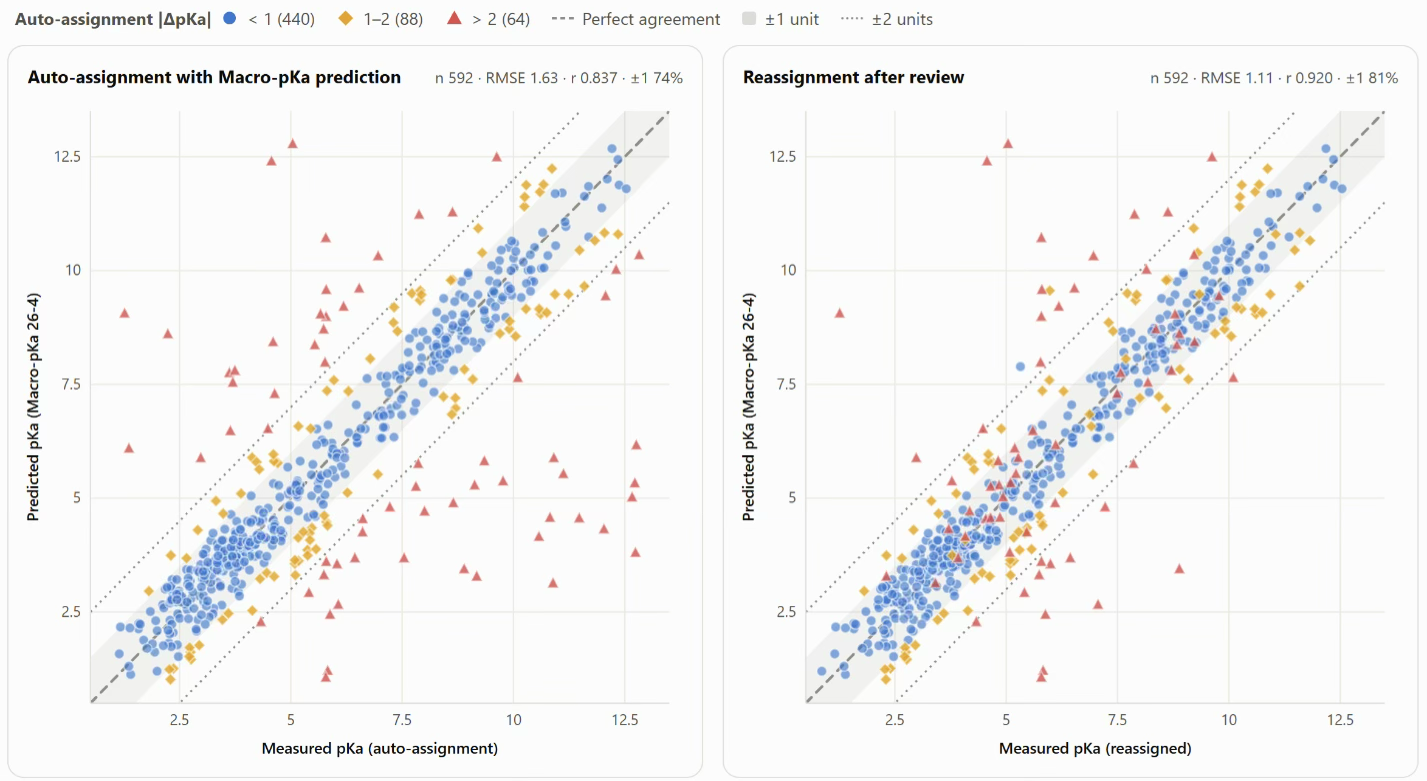
Experiment and computation as complementary interpretations of pKa measurements
Compound selection
Among the reported 719 compounds, several common functional groups involved in protonation and deprotonation processes were represented, including those associated with carboxylic acids, phenols, and substituted pyridines. Less common functional groups and heterocycles were also present, such as:
- 2-amino-acetonitriles
- Imidazolo[1,2-a]pyridines
- Thienopyrimidin-4-ones

Of particular interest were certain types of sulfonamides and ketones attached to heterocyclic rings; such compounds can participate in unintuitive, aromaticity-breaking tautomerism, as these examples show:

Some simple compounds were more suitable for a parallel logP study (discussed in the next section) conducted on the same SiriusT3 instrument. And because logP measurements required the empirical aqueous pKa as an input to determine data point collection and curve fitting, these compounds also contributed to our pKa data collection.
We believe that a large part of the pKa measurements performed by us were scientifically novel, i.e., reported publicly for the first time. On the other hand, a number of the smaller and simpler compounds from our compound collection already had their aqueous pKa values reported in the literature. These previously determined values can be used for valuable comparisons and accuracy control.
Results and observations
A comparison of measured and computationally modeled pKa values for each molecule constitutes its own story, perhaps with the exception of the simplest or most well-characterized compounds. A meaningful discussion of pKa values therefore often requires examining molecules individually or as related series, alongside the experimentally inferred and computationally modeled protonation equilibria corresponding to those transitions. Rather than reviewing every case individually, we highlight several representative examples below that capture broader lessons from the dataset.
• Multiple pKa Transitions: If a molecule can be protonated or deprotonated in steps more than once, it will have multiple pKa values, each acting as a “witness” to a transition between adjacent charge states. If an experiment detects two pKa transitions while a theoretical calculation predicts three for the same molecule, there are several possible explanations for the discrepancy:
- transition may fall outside the instrument’s titration range, typically pH 2-12;
- transitions may occur too close together to be resolved experimentally; or
- theoretical mispredictions in equilibria may lead to an erroneous anticipation of an extra pKa value within the titration range
Other explanations are also possible, and identifying the most relevant cause may not be clear. Reconciling experimental and theoretical pKa values is a challenge frequently discussed in the chemical literature14,15 and one that recurred throughout our project.
• Reactive Molecules: Reactive molecules are prone to degradation, such as oxidation, hydrolysis, or other reactions with the solvent, particularly under extreme pH conditions. Aldehydes, which were present in our first batch of compounds, proved particularly difficult to work with – the empirical pKa values often disagree with those from theoretical predictions. Interestingly, in some cases where good agreement was observed, the aldehyde was modeled as a hemiacetal, which is the hypothesized product from the reaction between the aldehyde and methanol co-solvent.
• Method Limitations: Some classes of compounds are intrinsically not suitable for treatment with the UV-metric method. Such compounds typically lack a UV-absorbing chromophore (e.g., a system of conjugated bonds) and/or changes in their protonation state do not sufficiently alter their UV-vis absorption behavior, thus misleading the pKa fitting algorithm. Examples include aliphatic amino acids and amines, as well as the aforementioned 2-amino-acetonitriles. For instance, the computationally predicted and the measured UV-metric pKa values for the series of 2-amino-acetonitriles resulted in complete disagreement. Identifying the method of measurement was likely the culprit; these molecules were retested using the potentiometric method, and excellent agreement was observed between theory and experiment.
• Interpreting Experimental Data: It is crucial to have access to reliable computational pKa prediction, such as that provided by Macro-pKa, when interpreting the experimental data in a systematic, reproducible, and high-throughput manner. While an experienced chemist could manually review each spectrum and map the reported pKa values to plausible transitions using chemical intuition and prior knowledge, this would be a laborious and inherently subjective process – one that would quickly become rate-limiting at scale and introduce additional risks of error. One of the most important outputs of the computational model is the expected number of pKa transitions in the experimental pH range, specifically 2-12 for the UV-metric method on the SiriusT3, which then serves as input for modeling the measured data. Deceptively similar molecules may have different numbers of pKa values in the titratable pH range, due to differences in electronic effects, tautomerization patterns, or the presence or absence of intramolecular hydrogen bonds. Consider two similar molecules from our test set:
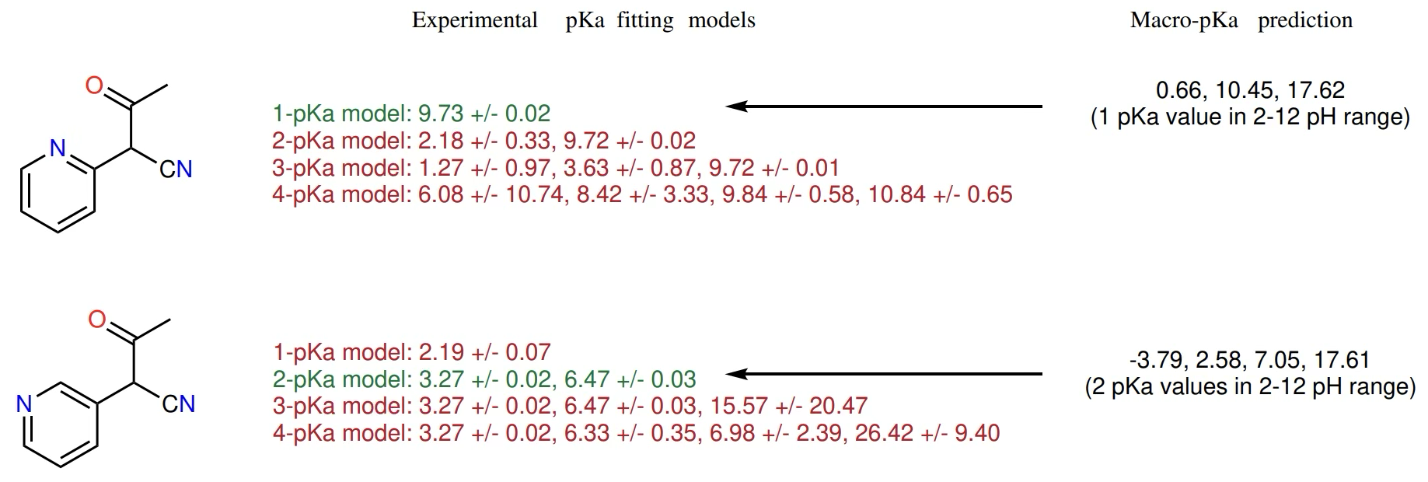
These molecules are shown in the tautomeric forms used in a commercial catalog, although Macro-pKa calculations indicate a different dominant tautomeric form for them in solution. Without Macro-pKa predictions, it is difficult to pick the experimental pKa fitting model, which provides a different interpretation of the experimental data. For the upper molecule, both the 1-pKa and 2-pKa models have low error bounds, but because the pKa of 2.18 carries greater uncertainty, the 1-pKa model with a single pKa of 9.73 is preferable. For the lower molecule, however, the two experimental pKa-fitting models (1-pKa and 2-pKa) both perform well yet yield markedly different results. The computational Macro-pKa predictions, which in addition to the macro-pKa values, also provide details on the populations of the tautomeric microstates for each charge, indicate only one pKa value in the titratable range for the upper molecule and two pKa values in the titratable range for the lower molecule. These theoretical predictions help us identify the most reliable experimental pKa values: 9.73 for the upper molecule and 3.27 and 6.47 for the lower one. Sometimes more than two experimental pKa models appear plausible, making it especially difficult to choose among them. Consider the following example from our test set:

Here, three experimental pKa fitting models (1-pKa, 2-pKa, and 3-pKa) have plausible pKa’s with low error bounds. It would be challenging to select the most chemically relevant one without a good model prediction, and using the wrong models would lead to erroneous experimental pKa results. Macro-pKa predicts 2 pKa transitions in the titratable range, leading us to choose the 2-pKa fitting model, with final experimental pKa values of 5.14 and 7.64.
The examples above illustrate how juxtaposing theoretical predictions with experimental measurements can increase confidence in the interpretation of experimental pKa values, particularly when multiple fitting models are plausible. Conversely, high-confidence empirical pKa values collected across several hundred chemically distinct molecules can provide useful input for training and refining Macro-pKa and other predictive models. Many individual molecules and novel series warrant deeper mechanistic analysis, and we intend to further interrogate the dataset and report these findings in greater detail in a future scientific publication.
logP: Physical Limits, QC, and the Necessity of In Silico Triage
Our logP study was driven by a related question from a different perspective: how new experimental measurements could expand chemical-space coverage and help us understand when we can extrapolate from the existing logP, and associated free-energy, models?
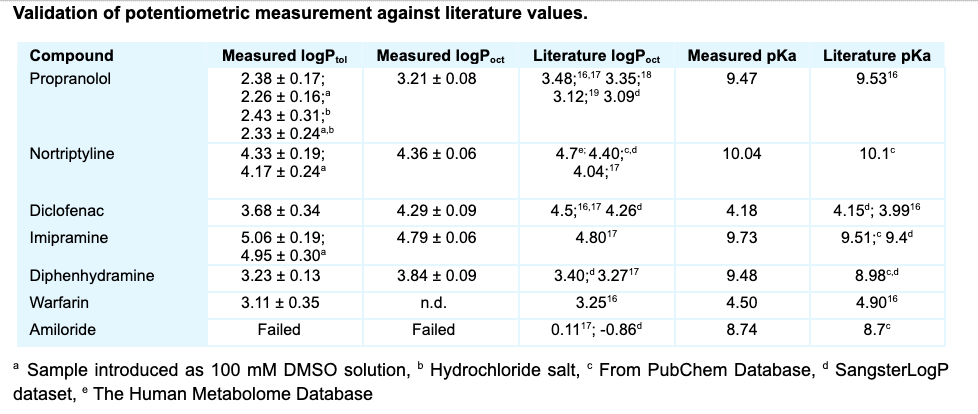
SiriusT3 offered a potentiometric approach complementary to the traditional shake-flask method, which offers the advantage of efficiency, throughput, and amenability of highly lipophilic analytes. We set off by validating this method on several well-studied drugs against the literature (see table below).
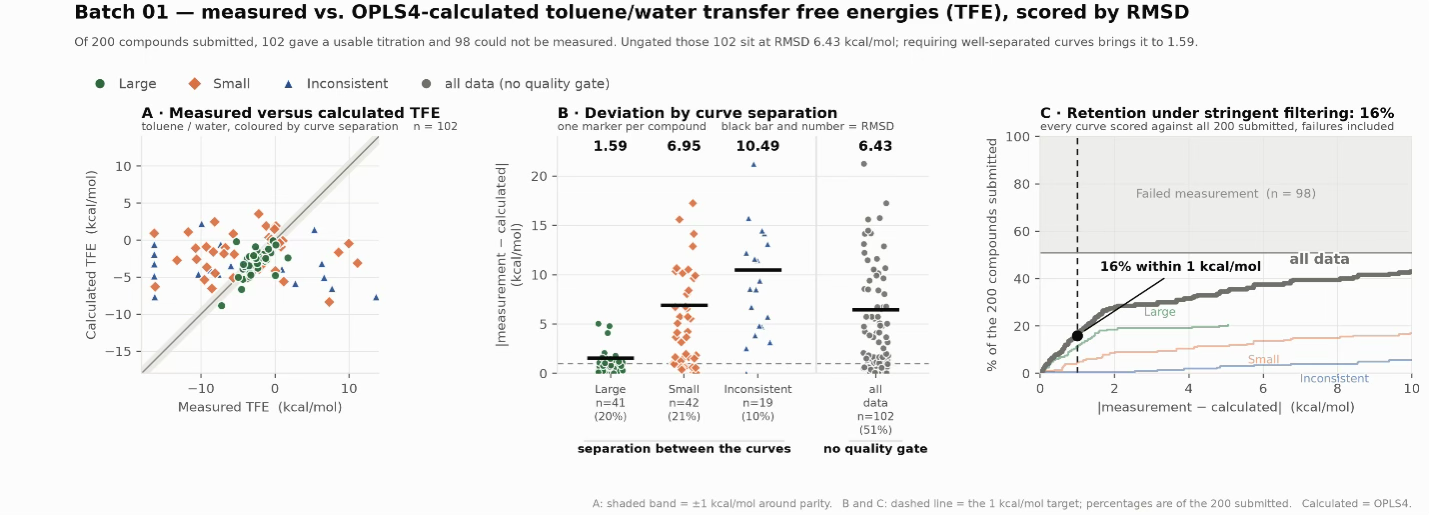
Of the 200 compounds, 102 yielded measurable logP values. Across this set, the RMSD between experimental and calculated TFEs was 6.4 kcal/mol, much larger than the expected difference, according to model benchmarking. We used this as a starting point to ask whether independent experimental features (e.g. quality-control metrics, repeat measurements, and the underlying titration behavior) could distinguish better-constrained measurements from those carrying greater uncertainty.
The physical experiment matters
Potentiometric logP measurement on the SiriusT3 still places important physical demands on the sample. The standard workflow uses 1-1.5 mg of accurately weighed neat material, and incomplete dissolution can complicate the equilibrium assumed by the measurement.
The first set of measurements induced us to modify the workflow to introduce samples as highly concentrated 100 mM DMSO stocks. This operation facilitated sample handling and improved run-to-run consistency while minimizing the amount of carrier solvent introduced into the assay. Not only did it improve the practical accessibility of challenging compounds but also highlighted a broader point: an experimentally reported physicochemical property is obtained through a real physical system, with assumptions and practical compromises between the ideal thermodynamic quantity and what can actually be measured.
logP, too, is an inference from a chain of data analysis.
The final logP value reported by SiriusT3Refine is not a direct instrument readout. Each measurement involves successive titrations with increasing amounts of toluene, followed by modeling and curve fitting with reference from the previously measured aqueous pKa.
We found that the separation between successive titration curves, i.e. the ΔpKa between each titration, correlated with agreement between experimental and calculated TFEs. Measurements with clearly separated curves were generally better constrained, whereas small and ambiguous pKa shifts were more often associated with larger discrepancies. Because our goal is to extend our logP understanding to the less explored chemical systems and not to optimize a small set of benchmark compounds, we used curve separation alongside assay-level metrics, such as titration-point count, RMSD across all titrations, and buffer index profile as experimental quality control (QC) criteria and revised the workflow for a second batch of 200 compounds.
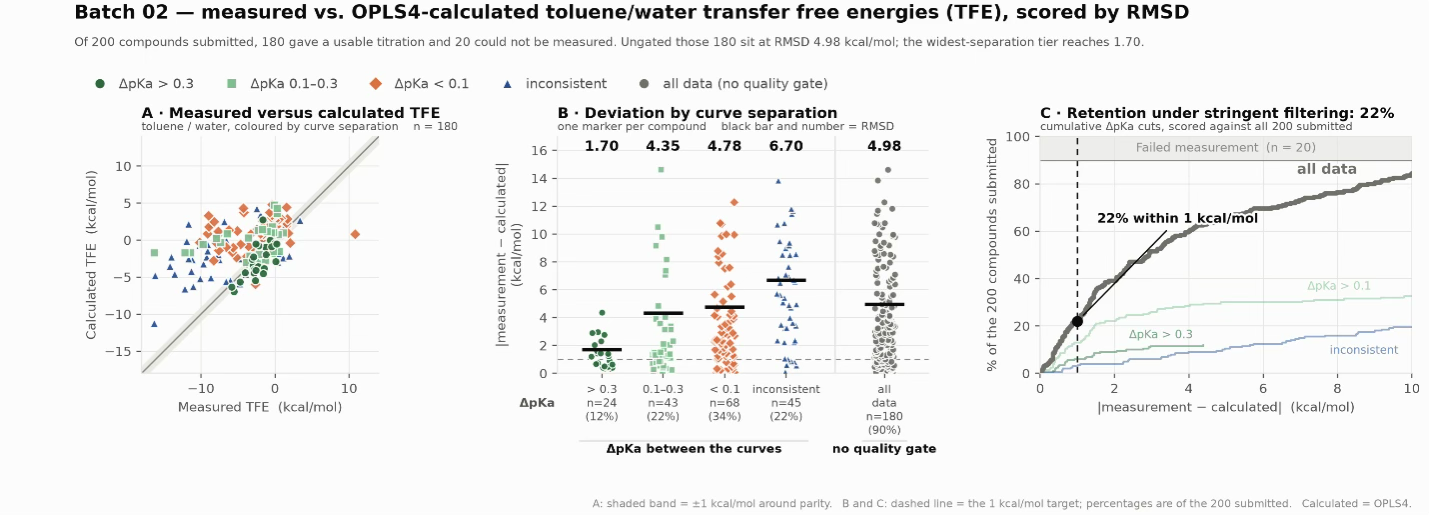
In the second batch, the experimental failure rate decreased markedly, and the same overall QC relationship persisted. By combining multiple quality filters and excluding measurements with potential tautomeric ambiguity, we identified a clean subset of 28 measurements with an RMSD of 1.6 kcal/mol and MAE of 1.1 kcal/mol.
Although this result remained above the expected 1 kcal/mol target and required considerable attrition, the analysis showed that experimental QC could meaningfully identify better-constrained measurements. The remaining discrepancy was not explained by the QC factors identified in this study, and the broader dataset does not yet meet the level of confidence we would want for quantitative model development.
More data is not automatically more useful. For this dataset, further work is needed to understand the remaining uncertainty, and we have therefore chosen not to release the complete logP dataset at this stage. The logP work was not simply about whether one method agreed with another: an experimental value is only as useful as our understanding of the assay, its uncertainty, and the context in which the data will be used. Progress therefore depends on close collaboration between experimental and computational scientists, bringing complementary evidence and constraints to the same problem. Researchers interested in the methodology or underlying analysis are welcome to reach out to discuss the findings in more detail.
Conclusion: Knowing When to Measure – and What a Measurement Adds
Taken together, the pKa and logP studies led us back to the strategic question that motivated the collaboration: When does performing another experimental measurement provide information that prediction or existing precedent cannot?
Our experience suggests that the answer lies not simply in generating more data, but in understanding the data we generated – particularly the source of discrepancies between experiment and prediction. In the pKa study, those discrepancies often revealed meaningful chemistry or limitations in measurement and interpretation, while computation provided useful context for resolving otherwise ambiguous experimental observations. In this sense, disagreement was often not a failure but the starting point for extracting more information from the measurement.
The same principle applies more broadly to physicochemical data. Before a new measurement can be useful for model development, we need to understand the assumptions behind the experiment, characterize its uncertainty, and determine the limits of its interpretation. That understanding allows us to improve the methodology and identify the conditions under which the resulting data are most informative.
The opportunity, therefore, is not simply to collect more data, but to understand the data, improve how we measure it, and then scale those measurements into the chemical space where they can teach us something new.
Acknowledgement
We would like to acknowledge everyone at Octant who contributed to this collaborative effort. In particular, we thank Dr. Scott Simpkins, Dr. Steven Edgar, Dr. Robert Warneford-Thomson, Dr. Marco Falcioni, Dr. Ana Lindahl, Dr. Yuning Shen, Calvin Hawe, Danny Tagaloa, Hugh Fox, Dr. Steve Richards, and Dr. Naomi Handly for their valuable contributions and support throughout the project.
We would like to thank our funders for their support of OpenADMET, in particular, ARPA-H, Radial (part of the Astera Institute (https://ror.org/00ydx1s47)), Schrödinger Inc., the Gates Foundation, and the OpenAI Foundation. We would also like to thank our partners Enamine, HuggingFace, OpenEye, CDD Vault, Discovery Life Sciences, and the beamline staff at NSLS-II for their support.
This work is supported by the Advanced Research Projects Agency for Health (ARPA-H) under AVOID-OME, and Award Number 1AY1AX000035. The contents are those of the authors. They may not reflect the policies of the Department of Health and Human Services or the U.S. government. The content is solely the responsibility of the authors and does not necessarily represent the official views of the Advanced Research Projects Agency for Health.
(Updated on 10/8/2026)
References
- Manallack, D. T. The pKa Distribution of Drugs: Application to Drug Discovery; 2007.
- Charifson, P. S.; Walters, W. P. Acidic and Basic Drugs in Medicinal Chemistry: A Perspective. J. Med. Chem. 2014, 57 (23), 9701–9717. https://doi.org/10.1021/jm501000a
- Arnott, J. A.; Planey, S. L. The Influence of Lipophilicity in Drug Discovery and Design. Expert Opin. Drug Discov. 2012, 7 (10), 863–875. https://doi.org/10.1517/17460441.2012.714363
- Johnson, T. W.; Gallego, R. A.; Edwards, M. P. Lipophilic Efficiency as an Important Metric in Drug Design. J. Med. Chem. 2018, 61 (15), 6401–6420. https://doi.org/10.1021/acs.jmedchem.8b00077
- Ripin, D. H.; Evans, D. A. Evans pKa Table. https://organicchemistrydata.org/hansreich/resources/pka/pka_data/evans_pKa_table.pdf (accessed Sep 2026).
- Bordwell, F. G. Equilibrium Acidities in Dimethyl Sulfoxide Solution. Acc. Chem. Res. 1988, 21, 456–463.
- Silverstein, T. P.; Heller, S. T. pKa Values in the Undergraduate: What Is the Real pKa of Water? J. Chem. Educ. 2017, 94 (6), 690–695. https://doi.org/10.1021/acs.jchemed.6b00623
- Pion Inc. SiriusT3 Automatic Titration System for pKa and Solubility Analysis. https://www.pion-inc.com/solutions/products/siriust3 (accessed Sep 2026).
- Takács-Novák, K.; Box, K. J.; Avdeef, A. Potentiometric pKa Determination of Water-Insoluble Compounds: Validation Study in Methanol/Water Mixtures. Int. J. Pharm. 1997, 151 (2), 235–248. https://doi.org/10.1016/S0378-5173(97)04907-7
- Avdeef, A.; Box, K. J.; Comer, J. E. A.; Gilges, M.; Hadley, M.; Hibbert, C.; Patterson, W.; Tam, K. Y. pH-Metric logP 11. pKa Determination of Water-Insoluble Drugs in Organic Solvent–Water Mixtures. J. Pharm. Biomed. Anal. 1999, 20 (4), 631–641. https://doi.org/10.1016/S0731-7085(98)00235-0
- Benito, D. E.; Acquaviva, A.; Castells, C. B.; Gagliardi, L. G. High Throughput Method to Characterize Acid-Base Properties of Insoluble Drug Candidates in Water. J. Pharm. Biomed. Anal. 2018, 154, 404–412. https://doi.org/https://doi.org/10.1016/j.jpba.2018.03.010
- Cao, Y.; Balduf, T.; Beachy, M. D.; Bennett, M. C.; Bochevarov, A. D.; Chien, A.; Dub, P. A.; Dyall, K. G.; Furness, J. W.; Halls, M. D.; Hughes, T. F.; Jacobson, L. D.; Kwak, H. S.; Levine, D. S.; Mainz, D. T.; Moore III, K. B.; Svensson, M.; Videla, P. E.; Watson, M. A.; Friesner, R. A. Quantum Chemical Package Jaguar: A Survey of Recent Developments and Unique Features. J. Chem. Phys. 2024, 161 (5), 052502. https://doi.org/10.1063/5.0213317
- Tang, H.; Jensen, K.; Houang, E.; McRobb, F. M.; Bhat, S.; Svensson, M.; Bochevarov, A.; Day, T.; Dahlgren, M. K.; Bell, J. A.; Frye, L.; Skene, R. J.; Lewis, J. H.; Osborne, J. D.; Tierney, J. P.; Gordon, J. A.; Palomero, M. A.; Gallati, C.; Chapman, R. S. L.; Jones, D. R.; Hirst, K. L.; Sephton, M.; Chauhan, A.; Sharpe, A.; Tardia, P.; Dechaux, E. A.; Taylor, A.; Waddell, R. D.; Valentine, A.; Janssens, H. B.; Aziz, O.; Bloomfield, D. E.; Ladha, S.; Fraser, I. J.; Ellard, J. M. Discovery of a Novel Class of DAmino Oxidase Inhibitors Using the Schrödinger Computational. J. Med. Chem. 2022, 65 (9), 6775–6802. https://doi.org/10.1021/acs.jmedchem.2c00118
- Fraczkiewicz, R. Thermodynamics-Informed Neural Networks and Extensive Data Sets: Key Factors to Accurate Blind Predictions of Apparent pKa Values in the EuroSAMPL Challenge. Physical Chemistry Chemical Physics 2025, 27 (16), 8039–8042. https://doi.org/10.1039/d5cp00165j
- Sipos-Szabó, L.; Bajusz, D.; Balogh, G. T.; Keserű, G. M. Benchmarking pKa Prediction against an Extensive, Public Data Set. J. Chem. Inf. Model. 2026, 66 (8), 4607–4619. https://doi.org/10.1021/acs.jcim.6c00107
- Avdeef, A.; Box, K. J.; Comer, J. E. A.; Hibbert, C.; Tam, K. Y. pH-Metric logP 10. Determination of Liposomal Membrane-Water Partition Coefficients of Ionizable Drugs. Pharm. Res. 1998, 15 (2), 209–215. https://doi.org/10.1023/A:1011954332221
- Benet, L. Z.; Broccatelli, F.; Oprea, T. I. BDDCS Applied to over 900 Drugs. AAPS Journal 2011, 13 (4), 519–547. https://doi.org/10.1208/s12248-011-9290-9
- Slater, B.; McCormack, A.; Avdeef, A.; Comer, J. E. A. pH-Metric Log P.4. Comparison of Partition Coefficients Determined by HPLC and Potentiometric Methods to Literature Values. J. Pharm. Sci. 1994, 83 (9), 1280–1283. https://doi.org/10.1002/jps.2600830918
- Mohsen-Nia, M.; Ebrahimabadi, A. H.; Niknahad, B. Partition Coefficient N-Octanol/Water of Propranolol and Atenolol at Different Temperatures: Experimental and Theoretical Studies. Journal of Chemical Thermodynamics 2012, 54, 393–397. https://doi.org/10.1016/j.jct.2012.05.021