Take Me Heme, Binding Modes: Wrapping up the CYP Inhibition Challenge
Let’s have those country roads take us to the finish line! After 2 months and more than 6,000 submissions, we finally have our winners.
Authors: Maria Castellanos, Jon Swain and Hugo MacDermott-Opeskin
DOI: 10.5281/zenodo.23985044
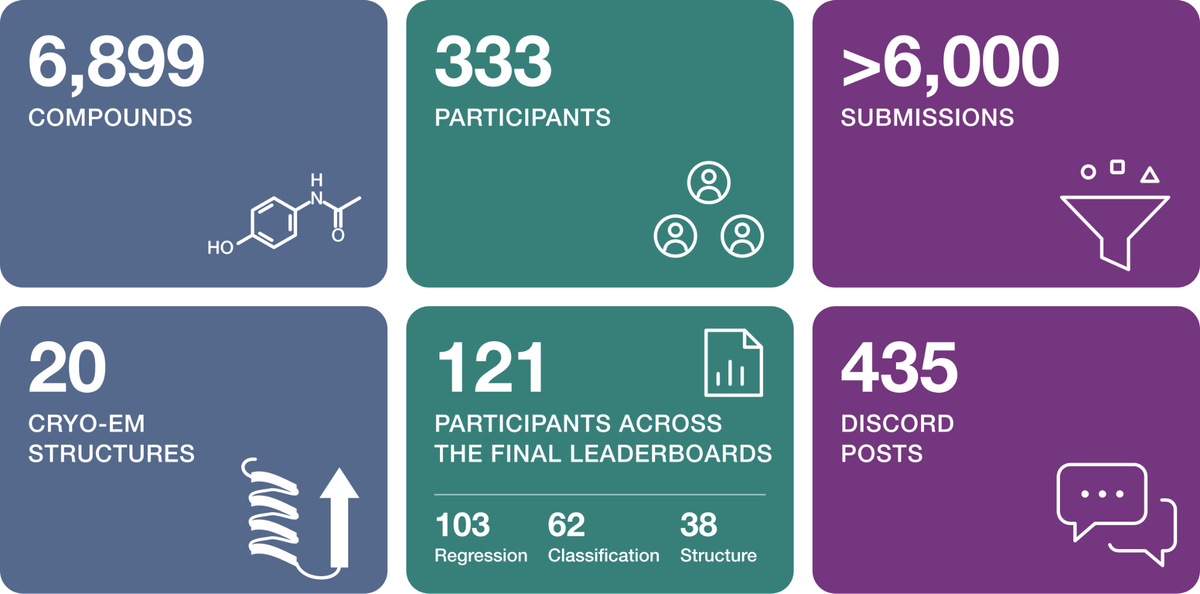
Cytochrome P450 (CYP) enzymes are the human body's primary workhorses for drug metabolism, making CYP inhibition a critical liability to model when predicting potential drug-drug interactions. To benchmark modern computational tools, OpenADMET generated high-throughput, high-fidelity inhibition data for 6,899 compounds across 4 CYPs.
Participants predicted activities across four crucial CYP isoforms that metabolize the vast majority of marketed drugs: CYP3A4, CYP2D6, CYP2C9, and CYP1A2. The challenge was divided across three different tracks:
- Direct Inhibition Track: A regression task to predict direct inhibition pIC50
- Time-Dependent Inhibition (TDI) Track: A classification task to identify compounds that exhibit time-dependent inhibition.
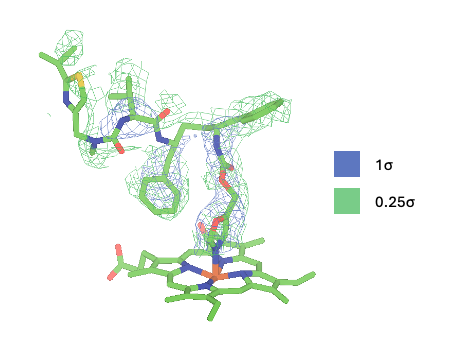
- Structure Prediction Track: A pose-prediction task evaluated against 20 novel CYP3A4 Cryo-EM complex structures.
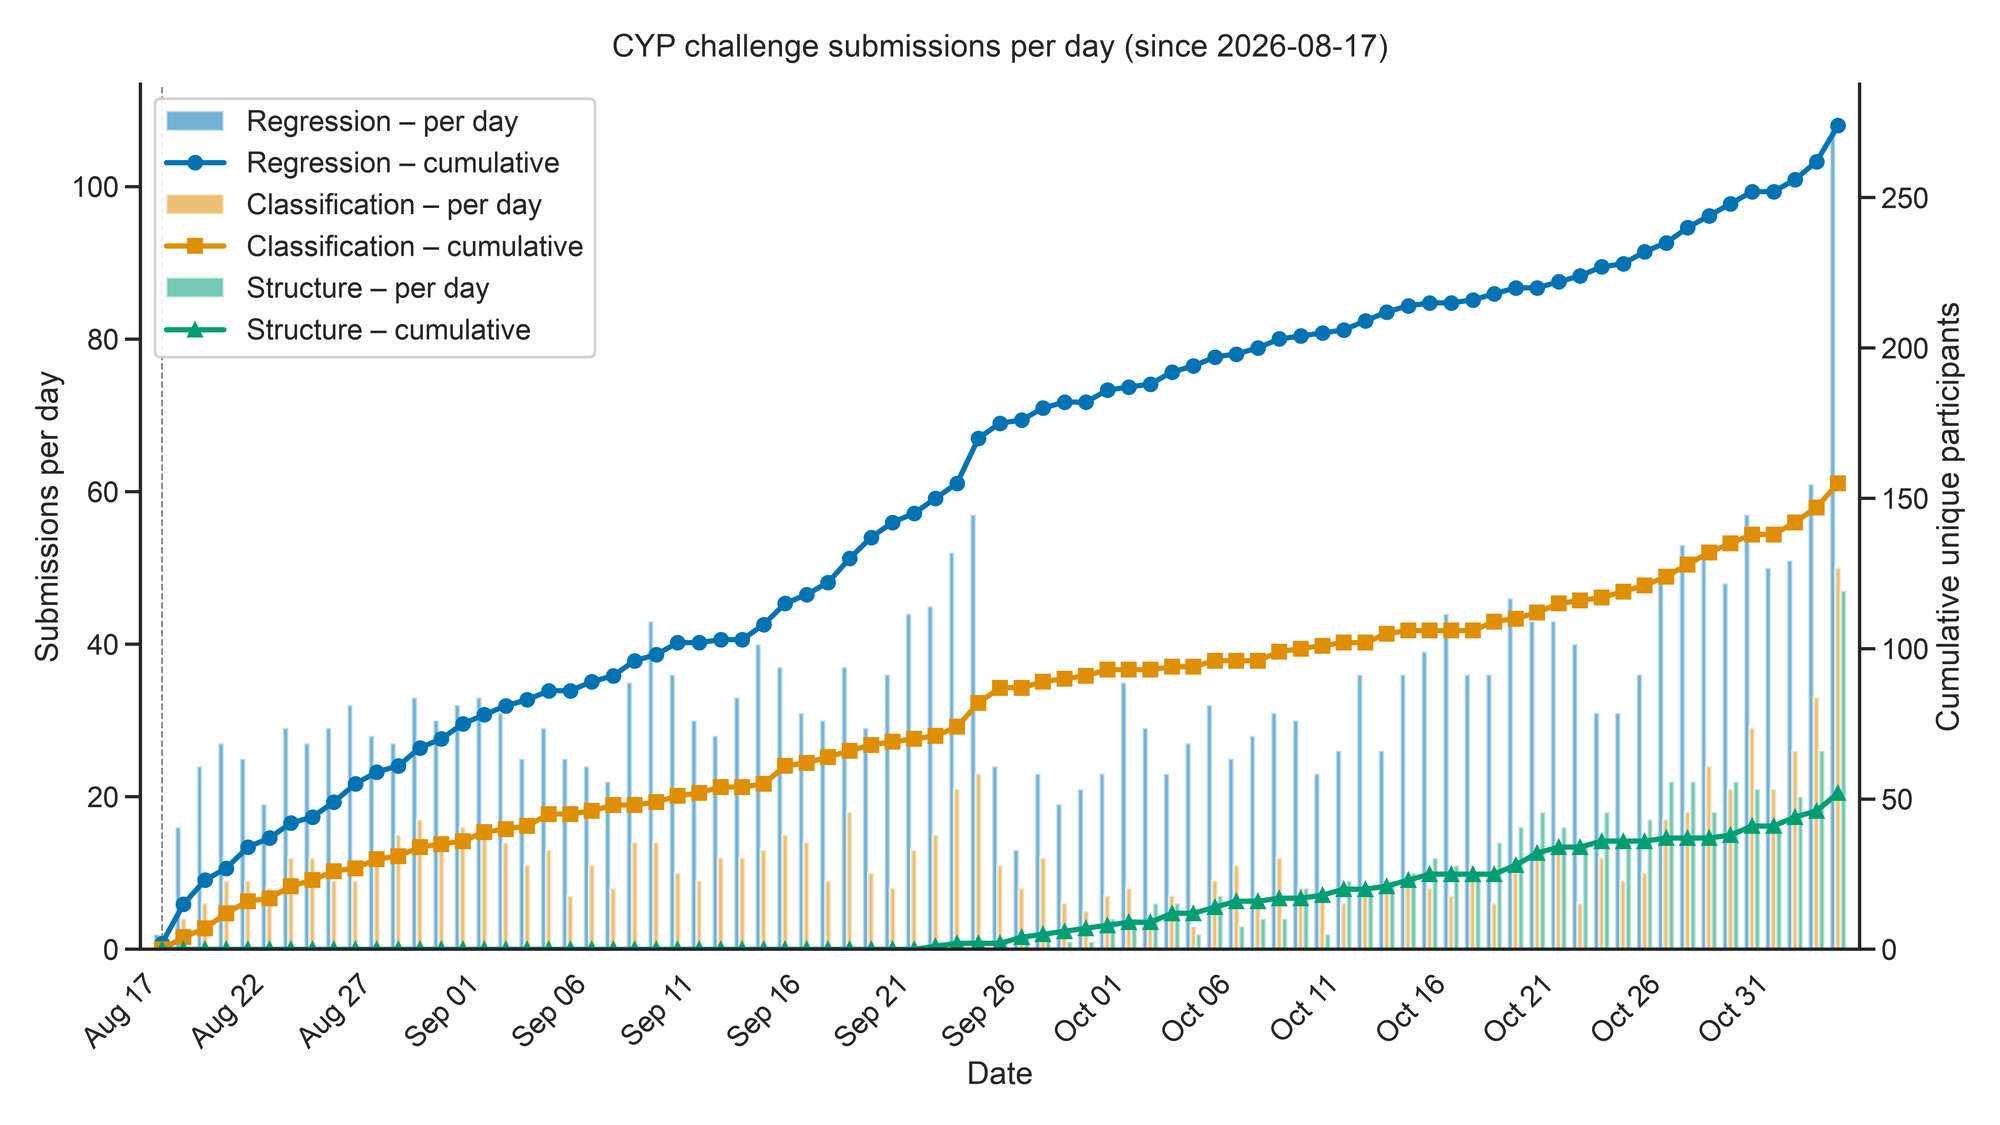
The community turned out in full force for this challenge. With over 6,000 submissions across the three tracks, we saw a total of 271 participants in Direct Inhibition, 155 in TDI, and 50 in the Structure track. We also just fully unblinded the entire dataset; now available on Hugging Face. Whether you participated or not, you can now access the complete set of inhibition data and structures to run your own post hoc analyses and train your models.
Now, without further ado, let’s look at the final leaderboards!
We’re crowning the Heme-coming King and Queen
We are excited to announce the winners of the CYP Inhibition Blind Challenge! Below, you will find the top 20 entries for each of the three tracks. Full interactive leaderboard tables are now available on the challenge Hugging Face space. Entries are grouped into tiers, with one tier containing all consecutive entries that were not statistically distinct from each other, and the next tier starting with the first entry found to be statistically distinct.
Note that these final leaderboards differ from their live versions available through the challenge. First, the ranking below reflects evaluation on the entire test set, while the live leaderboard evaluates only half of the test set; as a result, some entries may have shifted up or down compared to the live rankings. Second, we filtered the leaderboard to include only entries with a valid model report and a valid Hugging Face username, as explained in the challenge rules. Third, we removed teams suspected of cheating by submitting from multiple accounts (against the challenge rules), and that provided no valid justification for their actions.
How much did that reshuffle things? For the two activity tracks, remarkably little. Scoring the full test set instead of half moves the typical entry up one place in Direct Inhibition, up four in TDI, and keeps nine of the ten entries that led the live board in the final top ten. The Structure track saw the largest shifts, with only half of the live top ten remaining at the top, which is expected since the live board was scored on ten protein-ligand complexes only.
Direct inhibition leaderboard
Our regression task has 103 entries on the final leaderboard, spanning 29 performance tiers. Congratulations to whippoorwill and preheat-to-450, who make up Tier 1. You get to rock out as the stars of Heme-coming.
| Rank | Username | ST-RAE mean ± std | Spearman ρ | Report | Tier |
|---|---|---|---|---|---|
| 1 | whippoorwill | 0.341 ± 0.010 | 0.815 | report | Tier 1 |
| 2 | preheat-to-450 | 0.343 ± 0.010 | 0.814 | report | Tier 1 |
| 3 | NV-deCYPher | 0.355 ± 0.010 | 0.813 | report | Tier 2 |
| 4 | CyclinB | 0.357 ± 0.010 | 0.811 | report | Tier 2 |
| 5 | grapefruit | 0.368 ± 0.011 | 0.804 | report | Tier 3 |
| 6 | beast | 0.380 ± 0.011 | 0.802 | report | Tier 4 |
| 7 | wbot | 0.389 ± 0.011 | 0.785 | report | Tier 4 |
| 8 | rasayan-labs | 0.391 ± 0.011 | 0.794 | report | Tier 4 |
| 9 | SVM | 0.396 ± 0.011 | 0.793 | report | Tier 5 |
| 10 | hamza322 | 0.402 ± 0.011 | 0.792 | report | Tier 5 |
| 11 | chemcyps | 0.404 ± 0.011 | 0.795 | report | Tier 5 |
| 12 | nova | 0.405 ± 0.011 | 0.780 | report | Tier 5 |
| 13 | cyp-3po | 0.413 ± 0.011 | 0.782 | report | Tier 6 |
| 14 | GiantWizard | 0.415 ± 0.012 | 0.767 | report | Tier 6 |
| 15 | EleanorRigby | 0.418 ± 0.011 | 0.784 | report | Tier 6 |
| 16 | Scigantic | 0.421 ± 0.011 | 0.771 | report | Tier 6 |
| 17 | gogocyptron | 0.423 ± 0.012 | 0.766 | report | Tier 6 |
| 18 | Queimo | 0.425 ± 0.012 | 0.763 | report | Tier 6 |
| 19 | tguttenb1 | 0.426 ± 0.011 | 0.757 | report | Tier 6 |
| 20 | fin | 0.429 ± 0.011 | 0.762 | report | Tier 6 |
| Rank | Username | ST-RAE mean ± std | Spearman ρ | Report |
|---|---|---|---|---|
| 1 | whippoorwill | 0.336 ± 0.019 | 0.862 | report |
| 2 | preheat-to-450 | 0.343 ± 0.020 | 0.858 | report |
| 3 | CyclinB | 0.344 ± 0.019 | 0.860 | report |
| 4 | NV-deCYPher | 0.353 ± 0.019 | 0.864 | report |
| 5 | grapefruit | 0.356 ± 0.019 | 0.861 | report |
| 6 | rasayan-labs | 0.366 ± 0.020 | 0.845 | report |
| 7 | wbot | 0.372 ± 0.019 | 0.848 | report |
| 8 | beast | 0.385 ± 0.022 | 0.844 | report |
| 9 | Queimo | 0.385 ± 0.021 | 0.841 | report |
| 10 | SVM | 0.387 ± 0.020 | 0.845 | report |
| 11 | gogocyptron | 0.389 ± 0.022 | 0.840 | report |
| 12 | fin | 0.390 ± 0.022 | 0.842 | report |
| 13 | EleanorRigby | 0.391 ± 0.020 | 0.831 | report |
| 14 | Scigantic | 0.394 ± 0.019 | 0.840 | report |
| 15 | chemcyps | 0.395 ± 0.020 | 0.846 | report |
| 16 | hamza322 | 0.396 ± 0.022 | 0.834 | report |
| 17 | GiantWizard | 0.396 ± 0.022 | 0.841 | report |
| 18 | nova | 0.397 ± 0.023 | 0.842 | report |
| 19 | Zachary Kirby | 0.406 ± 0.021 | 0.829 | report |
| 20 | tguttenb1 | 0.406 ± 0.019 | 0.832 | report |
| Rank | Username | ST-RAE mean ± std | Spearman ρ | Report |
|---|---|---|---|---|
| 1 | whippoorwill | 0.285 ± 0.018 | 0.894 | report |
| 2 | preheat-to-450 | 0.290 ± 0.018 | 0.895 | report |
| 3 | CyclinB | 0.305 ± 0.017 | 0.890 | report |
| 4 | NV-deCYPher | 0.310 ± 0.018 | 0.884 | report |
| 5 | beast | 0.326 ± 0.018 | 0.882 | report |
| 6 | SVM | 0.328 ± 0.018 | 0.877 | report |
| 7 | nova | 0.336 ± 0.019 | 0.875 | report |
| 8 | grapefruit | 0.337 ± 0.019 | 0.870 | report |
| 9 | hamza322 | 0.340 ± 0.020 | 0.873 | report |
| 10 | chemcyps | 0.346 ± 0.018 | 0.874 | report |
| 11 | cyp-3po | 0.353 ± 0.020 | 0.869 | report |
| 12 | wbot | 0.353 ± 0.020 | 0.860 | report |
| 13 | fin | 0.353 ± 0.019 | 0.864 | report |
| 14 | GiantWizard | 0.355 ± 0.021 | 0.862 | report |
| 15 | tguttenb1 | 0.356 ± 0.020 | 0.860 | report |
| 16 | gogocyptron | 0.357 ± 0.021 | 0.868 | report |
| 17 | N283T | 0.359 ± 0.021 | 0.862 | report |
| 18 | EleanorRigby | 0.360 ± 0.020 | 0.861 | report |
| 19 | furtivepeony | 0.360 ± 0.021 | 0.860 | report |
| 20 | rasayan-labs | 0.360 ± 0.020 | 0.864 | report |
| Rank | Username | ST-RAE mean ± std | Spearman ρ | Report |
|---|---|---|---|---|
| 1 | preheat-to-450 | 0.435 ± 0.024 | 0.601 | report |
| 2 | NV-deCYPher | 0.435 ± 0.023 | 0.610 | report |
| 3 | whippoorwill | 0.445 ± 0.025 | 0.600 | report |
| 4 | CyclinB | 0.453 ± 0.026 | 0.598 | report |
| 5 | grapefruit | 0.454 ± 0.026 | 0.595 | report |
| 6 | beast | 0.472 ± 0.025 | 0.597 | report |
| 7 | rasayan-labs | 0.480 ± 0.024 | 0.592 | report |
| 8 | wbot | 0.495 ± 0.025 | 0.549 | report |
| 9 | cyp-3po | 0.506 ± 0.025 | 0.579 | report |
| 10 | chemcyps | 0.524 ± 0.030 | 0.569 | report |
| 11 | SVM | 0.530 ± 0.028 | 0.566 | report |
| 12 | hamza322 | 0.530 ± 0.026 | 0.576 | report |
| 13 | EleanorRigby | 0.533 ± 0.024 | 0.572 | report |
| 14 | RasLabD | 0.543 ± 0.029 | 0.575 | report |
| 15 | nova | 0.544 ± 0.025 | 0.519 | report |
| 16 | sandeepbii | 0.551 ± 0.027 | 0.566 | report |
| 17 | 2d6_yakuza | 0.554 ± 0.025 | 0.533 | report |
| 18 | Gashaw | 0.558 ± 0.028 | 0.534 | report |
| 19 | GiantWizard | 0.564 ± 0.028 | 0.490 | report |
| 20 | Scigantic | 0.565 ± 0.025 | 0.511 | report |
| Rank | Username | ST-RAE mean ± std | Spearman ρ | Report |
|---|---|---|---|---|
| 1 | whippoorwill | 0.298 ± 0.015 | 0.903 | report |
| 2 | preheat-to-450 | 0.304 ± 0.016 | 0.900 | report |
| 3 | NV-deCYPher | 0.321 ± 0.017 | 0.896 | report |
| 4 | grapefruit | 0.326 ± 0.016 | 0.888 | report |
| 5 | CyclinB | 0.326 ± 0.016 | 0.896 | report |
| 6 | gogocyptron | 0.332 ± 0.018 | 0.889 | report |
| 7 | wbot | 0.337 ± 0.016 | 0.885 | report |
| 8 | beast | 0.337 ± 0.016 | 0.887 | report |
| 9 | SVM | 0.340 ± 0.018 | 0.883 | report |
| 10 | hamza322 | 0.341 ± 0.016 | 0.885 | report |
| 11 | nova | 0.342 ± 0.017 | 0.885 | report |
| 12 | GiantWizard | 0.344 ± 0.017 | 0.878 | report |
| 13 | chemcyps | 0.353 ± 0.017 | 0.890 | report |
| 14 | cyp-3po | 0.353 ± 0.017 | 0.879 | report |
| 15 | Scigantic | 0.354 ± 0.017 | 0.873 | report |
| 16 | tguttenb1 | 0.358 ± 0.018 | 0.871 | report |
| 17 | horse-pusher | 0.358 ± 0.017 | 0.877 | report |
| 18 | rasayan-labs | 0.358 ± 0.018 | 0.877 | report |
| 19 | stir_bar | 0.359 ± 0.017 | 0.879 | report |
| 20 | briford | 0.361 ± 0.018 | 0.875 | report |
TDI leaderboard
Our classification task had 62 entries on the final leaderboard, spanning 5 performance tiers. Congratulations to rasayan-labs, nova, and NV-deCYPher, who make up Tier 1.
| Rank | Username | MCC mean ± std | F1 | Report | Tier |
|---|---|---|---|---|---|
| 1 | rasayan-labs | 0.498 ± 0.037 | 0.528 | report | Tier 1 |
| 2 | nova | 0.432 ± 0.044 | 0.508 | report | Tier 1 |
| 3 | NV-deCYPher | 0.420 ± 0.039 | 0.509 | report | Tier 1 |
| 4 | karriram | 0.409 ± 0.042 | 0.497 | report | Tier 2 |
| 5 | preheat-to-450 | 0.408 ± 0.039 | 0.490 | report | Tier 2 |
| 6 | MilkTeaEveryday | 0.408 ± 0.037 | 0.504 | report | Tier 2 |
| 7 | N283T | 0.403 ± 0.038 | 0.503 | report | Tier 2 |
| 8 | NIPERKOLKATA_PI_LAB | 0.400 ± 0.044 | 0.487 | report | Tier 2 |
| 9 | harinu123 | 0.400 ± 0.038 | 0.499 | report | Tier 2 |
| 10 | Asidsal11 | 0.389 ± 0.045 | 0.428 | report | Tier 2 |
| 11 | jeremy | 0.387 ± 0.038 | 0.488 | report | Tier 2 |
| 12 | Zachary Kirby | 0.385 ± 0.042 | 0.482 | report | Tier 2 |
| 13 | stir_bar | 0.378 ± 0.038 | 0.482 | report | Tier 2 |
| 14 | 01|96|30|597 | 0.372 ± 0.038 | 0.483 | report | Tier 2 |
| 15 | furtivepeony | 0.371 ± 0.036 | 0.483 | report | Tier 2 |
| 16 | sandeepbii | 0.366 ± 0.037 | 0.469 | report | Tier 2 |
| 17 | horse-pusher | 0.363 ± 0.040 | 0.470 | report | Tier 2 |
| 18 | EleanorRigby | 0.361 ± 0.038 | 0.459 | report | Tier 2 |
| 19 | CYP Blackberry | 0.356 ± 0.035 | 0.474 | report | Tier 2 |
| 20 | cyclinB | 0.355 ± 0.034 | 0.447 | report | Tier 2 |
| Rank | Username | MCC mean ± std | F1 | Report |
|---|---|---|---|---|
| 1 | rasayan-labs | 0.490 ± 0.066 | 0.403 | report |
| 2 | nova | 0.386 ± 0.080 | 0.378 | report |
| 3 | karriram | 0.342 ± 0.076 | 0.362 | report |
| 4 | Asidsal11 | 0.338 ± 0.082 | 0.266 | report |
| 5 | NV-deCYPher | 0.330 ± 0.071 | 0.360 | report |
| 6 | sandeepbii | 0.325 ± 0.067 | 0.365 | report |
| 7 | harinu123 | 0.322 ± 0.068 | 0.362 | report |
| 8 | NIPERKOLKATA_PI_LAB | 0.312 ± 0.080 | 0.312 | report |
| 9 | jeremy | 0.309 ± 0.068 | 0.351 | report |
| 10 | N283T | 0.305 ± 0.068 | 0.346 | report |
| 11 | wikke69 | 0.302 ± 0.065 | 0.345 | report |
| 12 | preheat-to-450 | 0.301 ± 0.069 | 0.338 | report |
| 13 | Zachary Kirby | 0.296 ± 0.076 | 0.314 | report |
| 14 | horse-pusher | 0.292 ± 0.073 | 0.326 | report |
| 15 | Chloie | 0.290 ± 0.074 | 0.319 | report |
| 16 | MilkTeaEveryday | 0.287 ± 0.067 | 0.331 | report |
| 17 | 450nm | 0.285 ± 0.066 | 0.328 | report |
| 18 | curiousone | 0.279 ± 0.066 | 0.323 | report |
| 19 | 01|96|30|597 | 0.277 ± 0.068 | 0.319 | report |
| 20 | KR LAB Bio | 0.277 ± 0.061 | 0.319 | report |
| Rank | Username | MCC mean ± std | F1 | Report |
|---|---|---|---|---|
| 1 | cyclinB | 0.552 ± 0.034 | 0.686 | report |
| 2 | MilkTeaEveryday | 0.529 ± 0.033 | 0.677 | report |
| 3 | EleanorRigby | 0.521 ± 0.029 | 0.681 | report |
| 4 | preheat-to-450 | 0.516 ± 0.034 | 0.642 | report |
| 5 | NV-deCYPher | 0.510 ± 0.034 | 0.659 | report |
| 6 | rasayan-labs | 0.506 ± 0.035 | 0.654 | report |
| 7 | N283T | 0.502 ± 0.034 | 0.661 | report |
| 8 | stir_bar | 0.500 ± 0.033 | 0.667 | report |
| 9 | NIPERKOLKATA_PI_LAB | 0.488 ± 0.033 | 0.662 | report |
| 10 | nova | 0.478 ± 0.034 | 0.638 | report |
| 11 | harinu123 | 0.477 ± 0.034 | 0.636 | report |
| 12 | thinkMolecular | 0.477 ± 0.035 | 0.633 | report |
| 13 | Lizard Wizard Gizzard | 0.476 ± 0.030 | 0.655 | report |
| 14 | furtivepeony | 0.476 ± 0.032 | 0.654 | report |
| 15 | karriram | 0.475 ± 0.034 | 0.633 | report |
| 16 | SC38 | 0.475 ± 0.035 | 0.637 | report |
| 17 | Zachary Kirby | 0.475 ± 0.033 | 0.650 | report |
| 18 | Gashaw | 0.470 ± 0.036 | 0.618 | report |
| 19 | 01|96|30|597 | 0.467 ± 0.033 | 0.647 | report |
| 20 | jeremy | 0.465 ± 0.036 | 0.625 | report |
A classification task contains much less information than a regression task (only one bit per compound, compared to a wide range of possible values per compound for a regression task). In addition, the CYP2D6 ground truth had only a small number of positives. This made overfitting to the live leaderboard more likely. Some teams tried new techniques, checked whether this changed performance on the live leaderboard, and reversed output classes if performance fell. Even keeping half the dataset hidden wasn’t enough to penalize this, since the final leaderboard included the compounds used for the live leaderboard.
The table below illustrates the overfitting. All top teams showed a noticeable drop-off in performance between their final leaderboard MA-MCC and an MA-MCC calculated post hoc on only the hidden compounds. This was a limitation of our challenge design. Since this was our first classification challenge, we are still learning the best way to score these. The published leaderboard is valid, as these teams performed best under the defined rules, but for future challenges we will use only the hidden compounds for the final leaderboard, not the entire test set. An extra congratulations to SC38, jeremy, and wikke69, who were our top three when scoring only on the hidden compounds!
| LB Rank | Leaderboard Name | MA-MCC (All compounds) |
MA-MCC (Hidden compounds) |
LB Rank (Only hidden compounds) |
|---|---|---|---|---|
| 1 | rasayan-labs | 0.498 | 0.235 | 52 |
| 2 | nova | 0.432 | 0.234 | 53 |
| 3 | NV-deCYPher | 0.420 | 0.337 | 10 |
| 4 | karriram | 0.409 | 0.289 | 34 |
| 5 | preheat-to-450 | 0.408 | 0.284 | 37 |
| 6 | MilkTeaEveryday | 0.408 | 0.336 | 11 |
| 7 | N283T | 0.403 | 0.344 | 7 |
| 8 | NIPERKOLKATA_PI_LAB | 0.400 | 0.269 | 42 |
| 9 | harinu123 | 0.400 | 0.333 | 12 |
| 10 | Asidsal11 | 0.389 | 0.215 | 55 |
Structure leaderboard
Our Structure task has 38 entries on the final leaderboard, spanning 4 performance tiers. With a much smaller dataset than the regression or classification tasks, it was harder to show statistically significant differences between entries, meaning the tiers spanned a wide range of entries on the final leaderboards.
| Rank | Username | LDDT-PLI mean ± std | RMSD Å | Report | Tier |
|---|---|---|---|---|---|
| 1 | dargason | 0.481 ± 0.043 | 3.437 | report | Tier 1 |
| 2 | curiousone | 0.454 ± 0.045 | 3.574 | report | Tier 1 |
| 3 | harinu123 | 0.449 ± 0.041 | 3.644 | report | Tier 1 |
| 4 | Scigantic | 0.448 ± 0.042 | 3.644 | report | Tier 1 |
| 5 | KaiGenesis | 0.446 ± 0.042 | 3.802 | report | Tier 1 |
| 6 | discoverybytes | 0.440 ± 0.033 | 3.618 | report | Tier 1 |
| 7 | Zachary Kirby | 0.438 ± 0.032 | 3.622 | report | Tier 1 |
| 8 | willvith | 0.436 ± 0.044 | 3.674 | report | Tier 1 |
| 9 | talindrew | 0.434 ± 0.034 | 3.809 | report | Tier 1 |
| 10 | ADMET Bo$$ | 0.433 ± 0.034 | 3.814 | report | Tier 1 |
| 11 | rasayan-labs | 0.425 ± 0.038 | 3.717 | report | Tier 1 |
| 12 | furtivepeony | 0.422 ± 0.038 | 3.736 | report | Tier 1 |
| 13 | nova | 0.415 ± 0.039 | 4.001 | report | Tier 1 |
| 14 | Athens Boltz-2 | 0.413 ± 0.037 | 3.946 | report | Tier 2 |
| 15 | 01|96|30|597 | 0.413 ± 0.030 | 3.970 | report | Tier 2 |
| 16 | chemops_cyp | 0.410 ± 0.035 | 4.058 | report | Tier 2 |
| 17 | Asidsal11 | 0.410 ± 0.035 | 3.931 | report | Tier 2 |
| 18 | ADMETForge | 0.409 ± 0.034 | 4.070 | report | Tier 2 |
| 19 | mai | 0.406 ± 0.033 | 3.997 | report | Tier 2 |
| 20 | coconut-research | 0.405 ± 0.032 | 3.917 | report | Tier 2 |
How did we do?
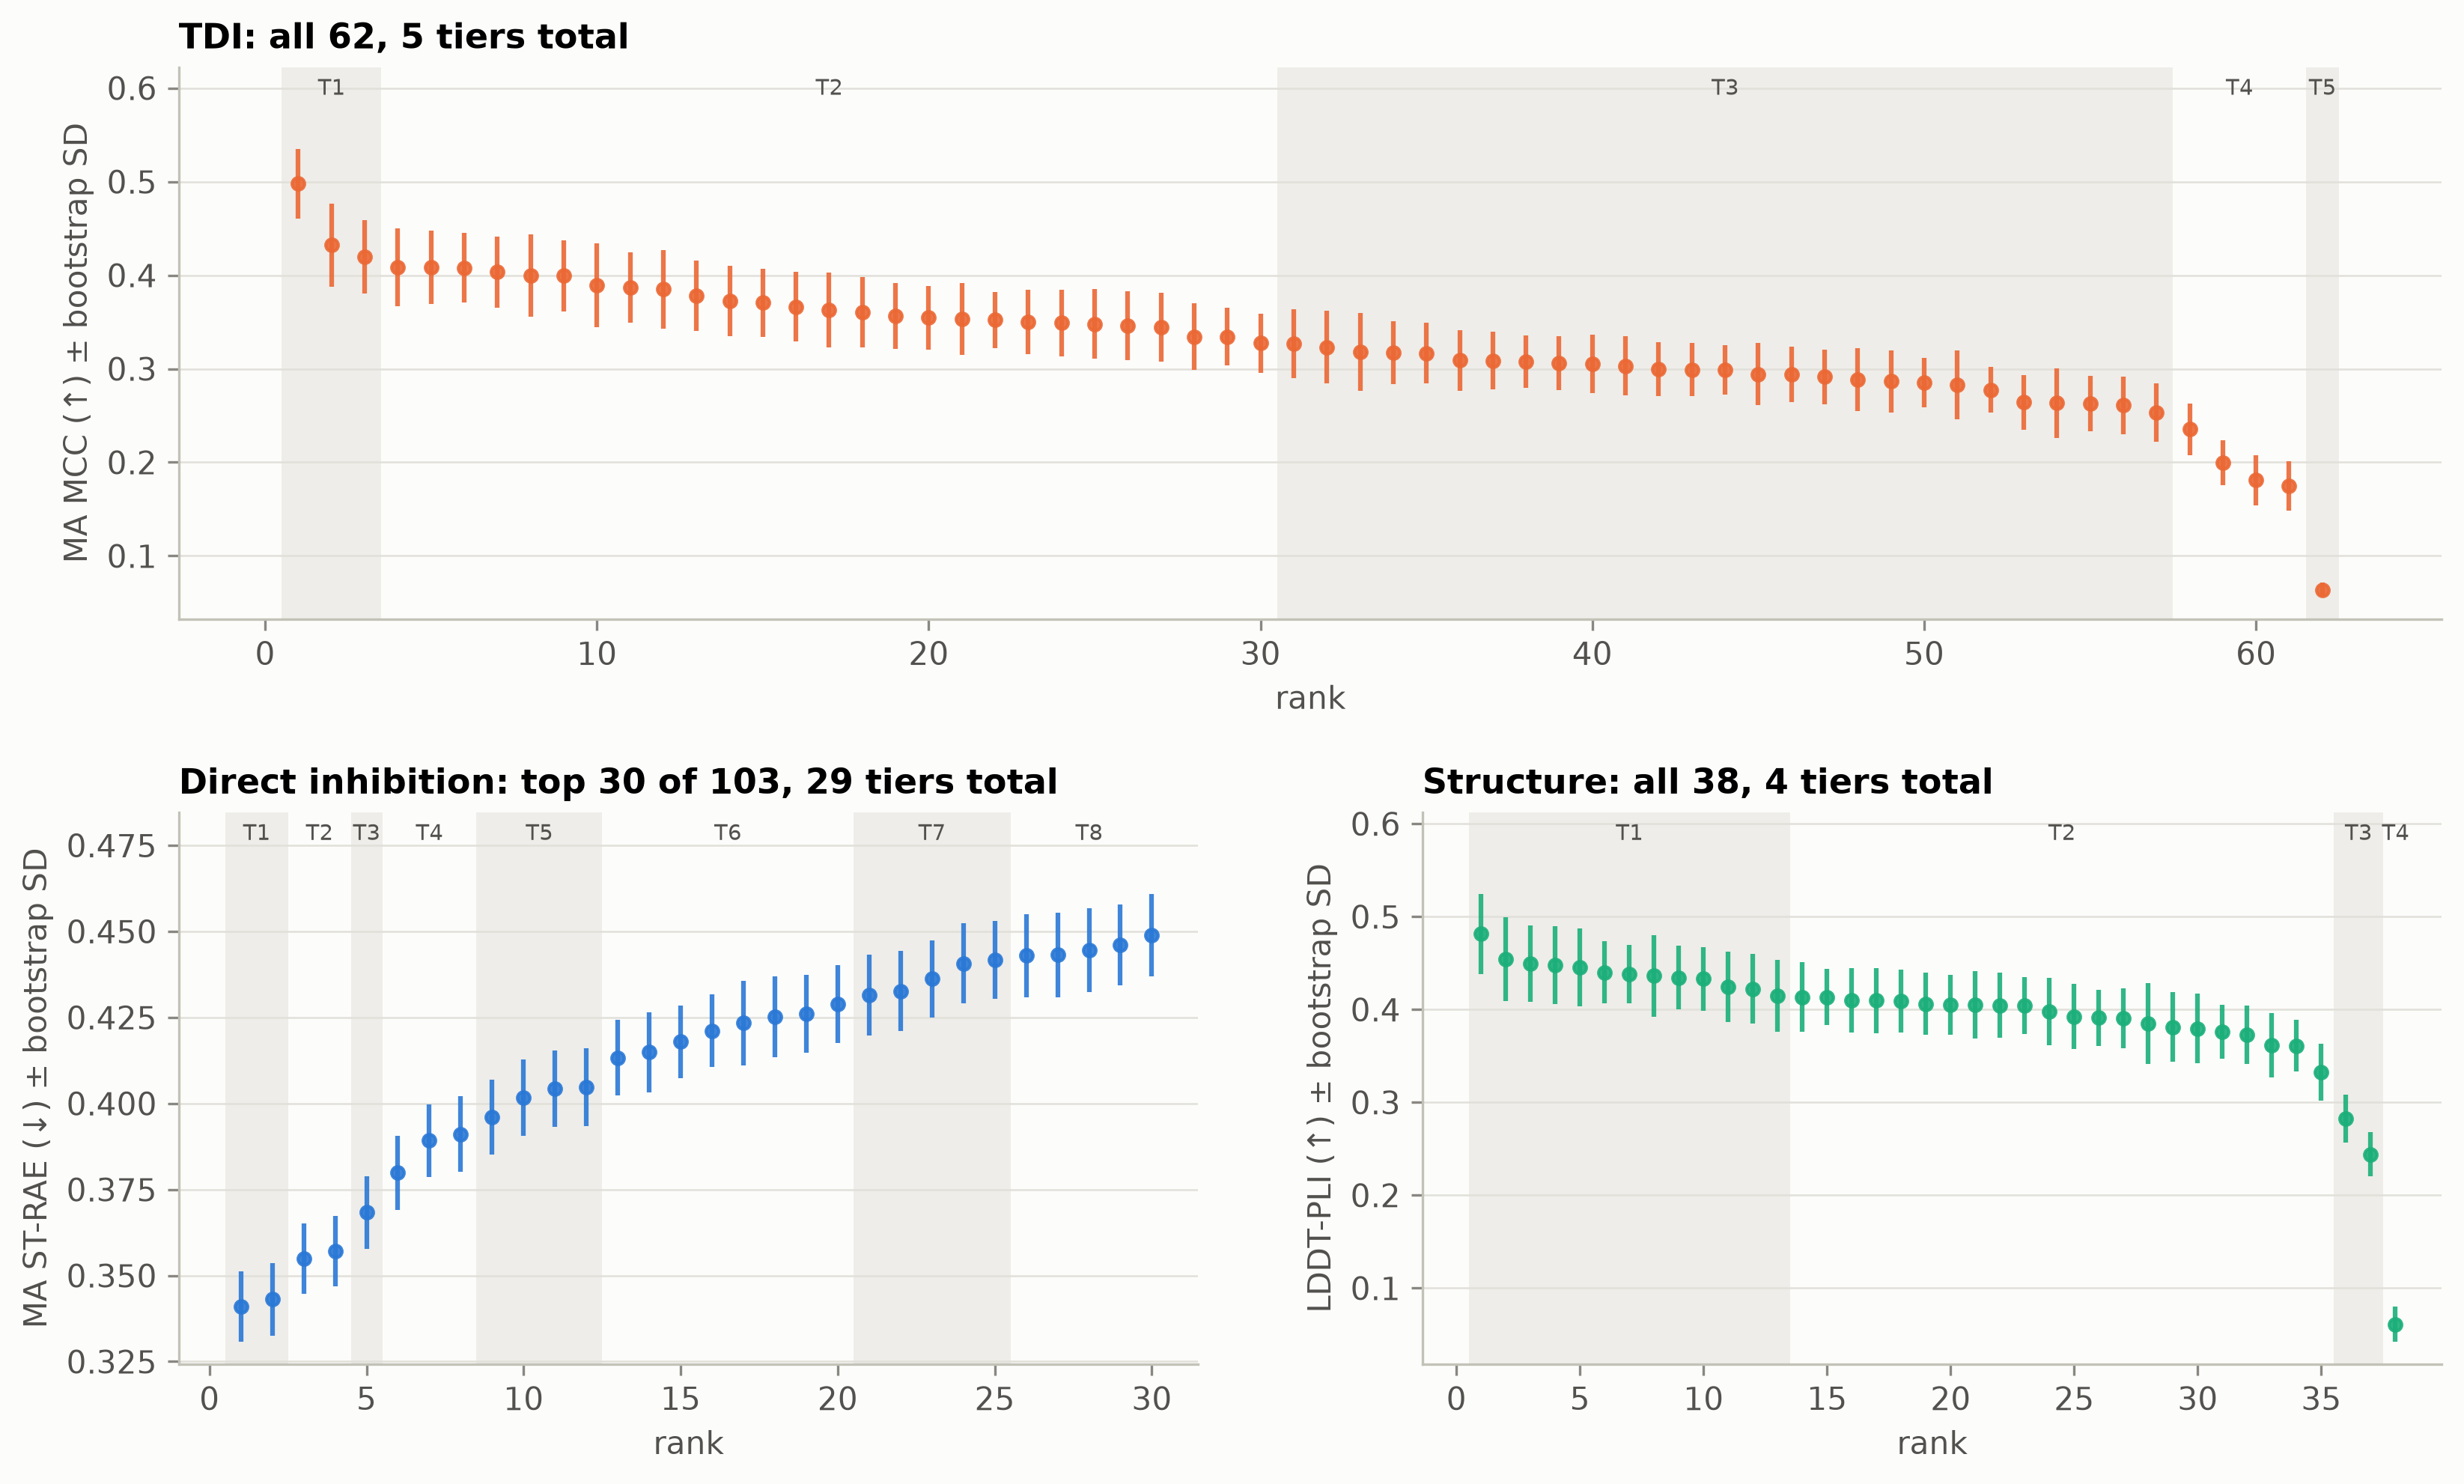
We chose a "tiering" system to rank the entries on the leaderboard, which used a paired bootstrap method with the Benjamini-Hochberg procedure to control the false discovery rate to group entries that are not significantly distinct from each other, allowing us to accurately present the differences between entries at the top of the leaderboard. The three tracks had different tier distributions (Figure 1): Direct Inhibition was more finely resolved, with 103 entries split into 29 tiers and the top 5 spanning only 3 tiers. With 750 compounds scored across four isoforms, the bootstrap uncertainty on a single entry is only about ±0.01 ST-RAE, so even small gaps near the top resulted in real differences. In contrast, TDI performance was more homogeneous, with 62 entries split into five tiers, and teams ranked 4 to 57 sitting in just two tiers. The structure track was an even closer match, with 38 entries divided between four tiers, and Tier 1 holding the first 13 entries. Because the structure dataset spanned only 20 complexes, each entry has an error bar of about ±0.04 LDDT-PLI, almost as wide as the 0.07 separating the best entry (0.48) from the 13th (0.42).
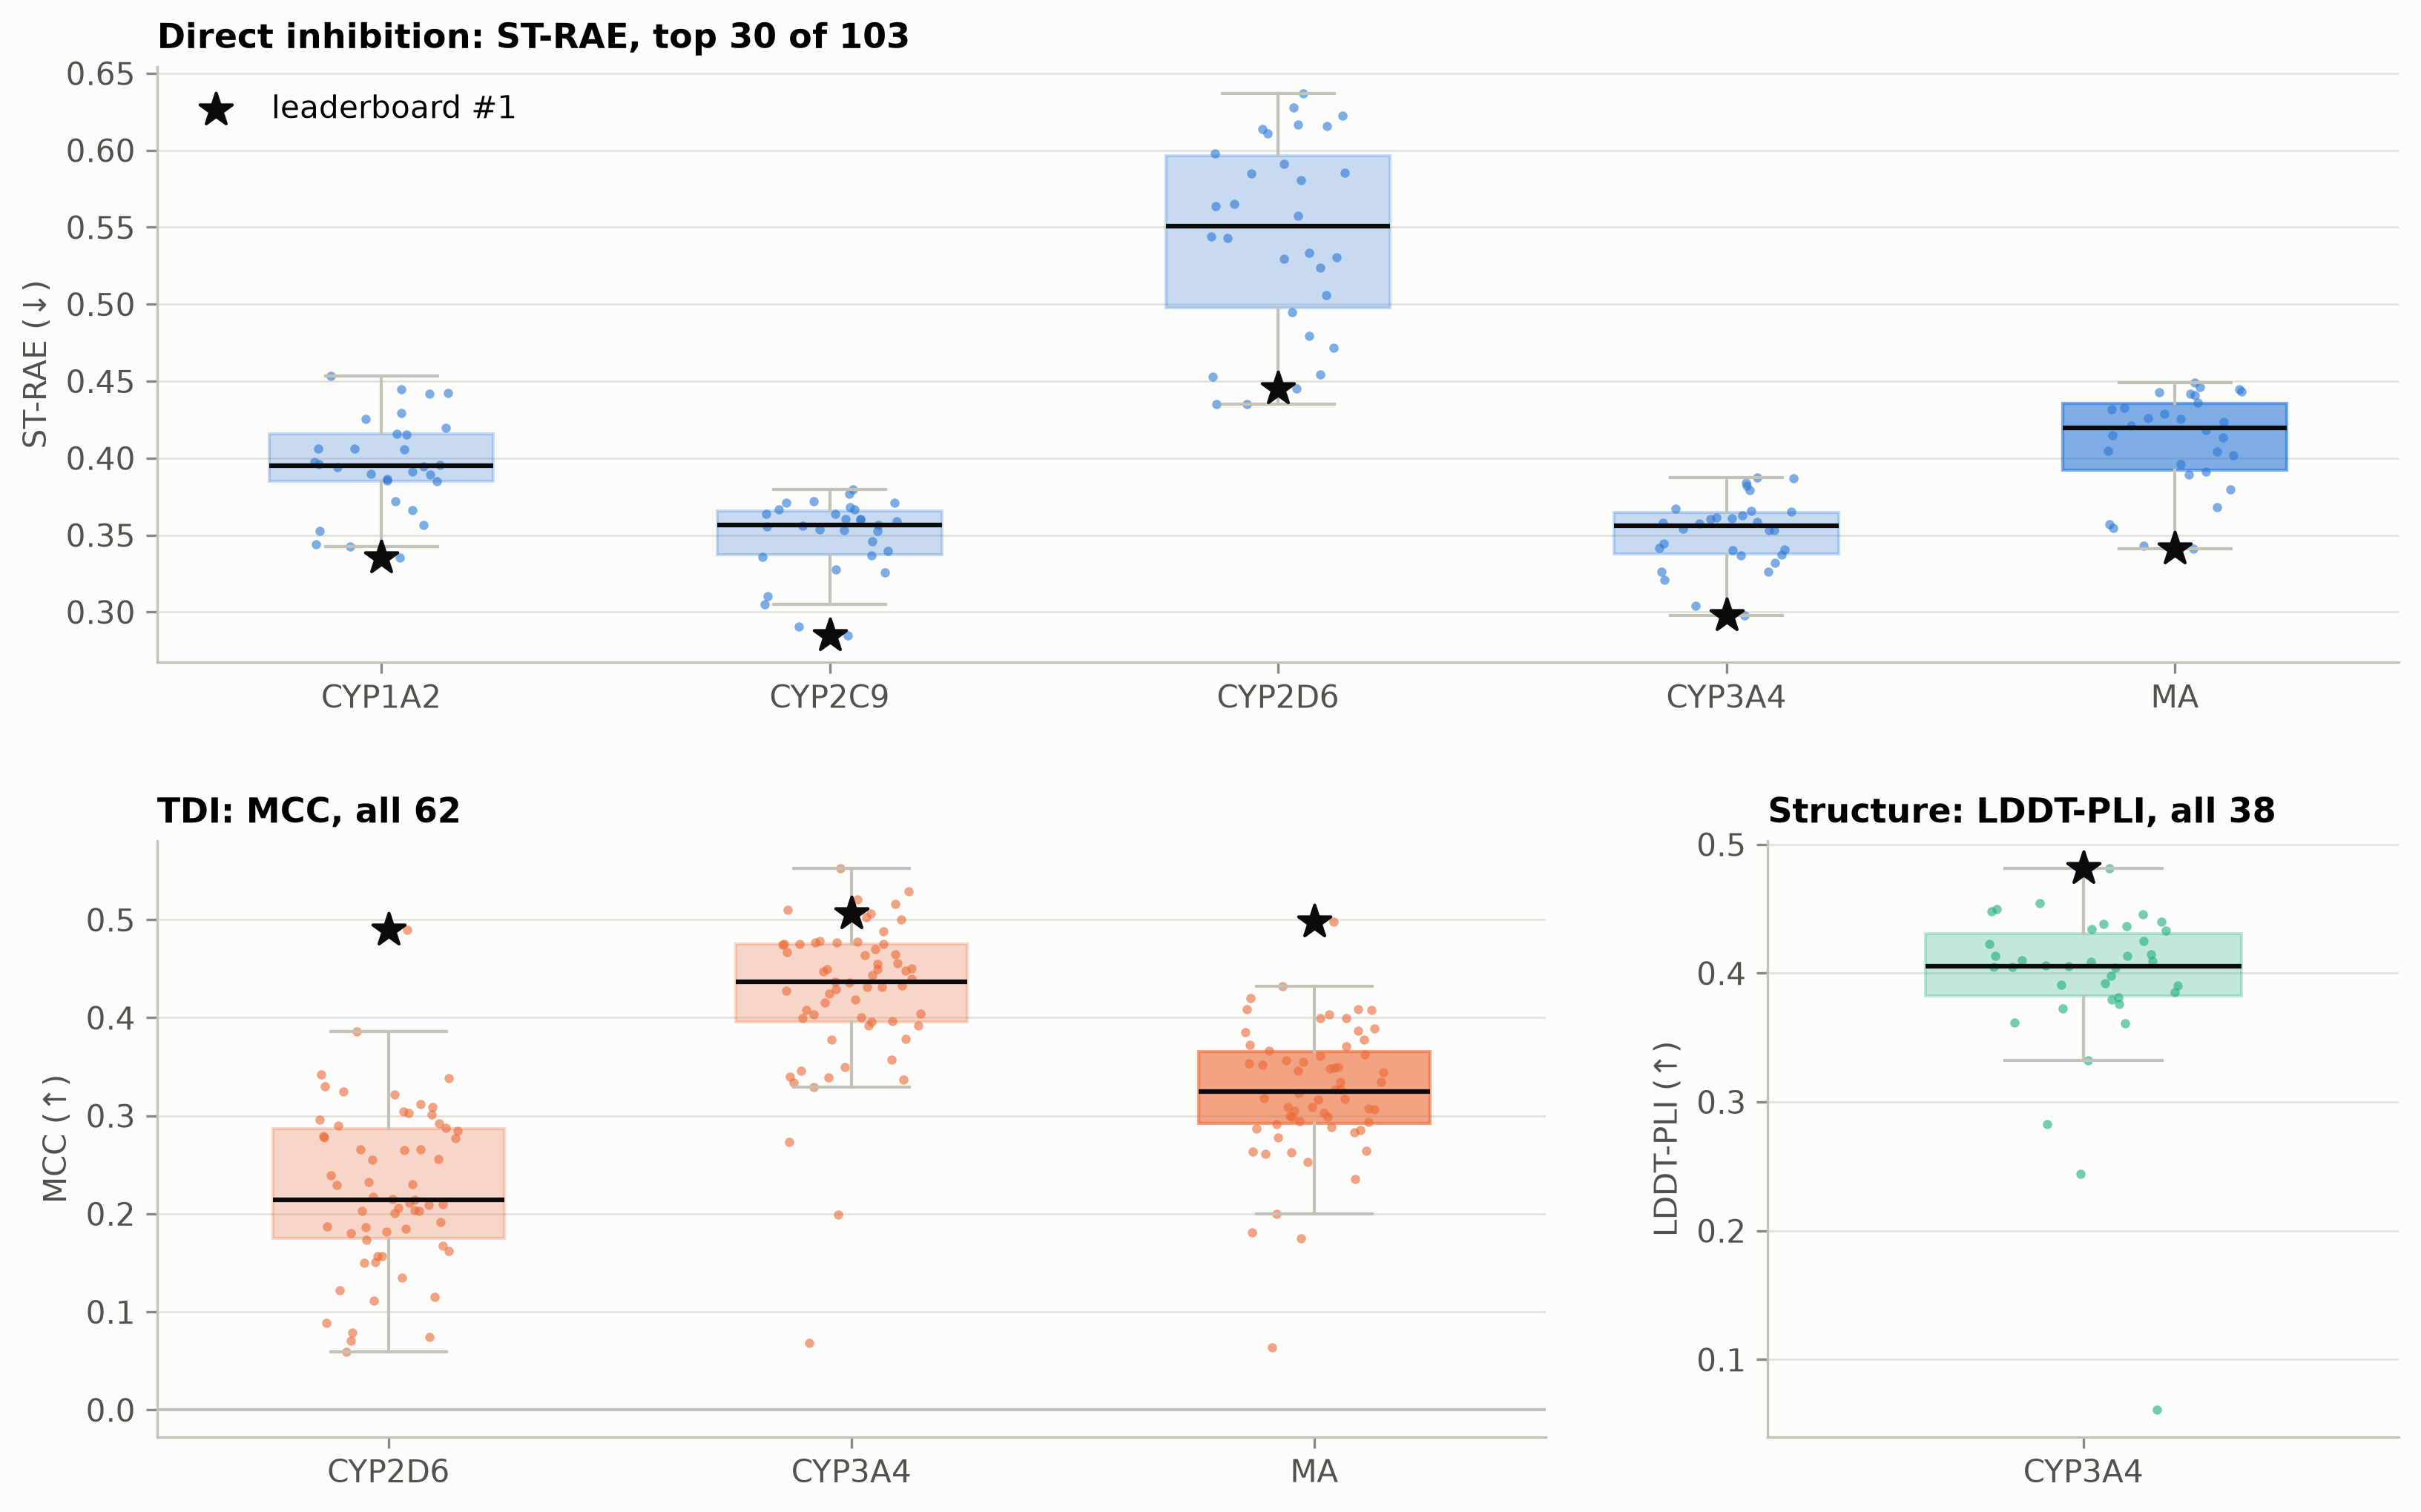
One notable observation in the final performance was that some isoforms were significantly harder to model than others. While 101 of the 103 final Direct Inhibition entries beat a naive mean prediction baseline (i.e., predicting the mean of the test set for all compounds, ST-RAE < 1), CYP2D6 proved to be a challenging target, with a median ST-RAE of 0.71. On the other hand, CYP2C9 and CYP3A4 were the most tractable (median ST-RAE 0.44 and 0.46), and CYP1A2 sat in the middle (0.52). In terms of ranking, the difference is even more stark, with the other three isoforms having a median Spearman correlation of 0.80-0.85, and CYP2D6 scoring 0.44. As we discussed in our interim leaderboard release, CYP2D6 was harder to predict because the train and test sets had completely different distributions due to the way we designed the test set (CYP2D6 Dose Response Curves were not available for expansion). As a result, the CYP2D6 test set was dominated by inactives (65% of compounds having a pIC50 below 4), compared to a more evenly distributed training set (9% below pIC50 4). As a result, models trained on this higher-potency training set systematically overpredicted the test set, and the entries that performed well on CYP2D6 were largely those that recalibrated downward. The TDI track showed a similar pattern. CYP3A4 TDI was reasonably learnable (median MCC 0.44, with the best at 0.55), while CYP2D6 TDI was harder (median 0.22, best 0.49). The culprit was class imbalance: only 44 of the 748 test compounds (5.9%) were CYP2D6 time-dependent inhibitors, compared with 21.6% in the training data, leaving very little positive signal.
The Structure track proved the hardest of the three. The best entry reached an LDDT-PLI of 0.48 (median 0.41), and only 8.9% of all submitted poses were within 2 Å BiSyRMSD of the experimental ligand position. Interestingly, with a median LDDT-PLI of 0.82, participants overwhelmingly found the right binding site but placed the ligand incorrectly within it. CYP3A4's notably large and flexible active site makes finding the correct pose challenging.
Head-to-head comparisons
We have also added a head-to-head tab to the challenge’s Hugging Face space. You can pick any two entries and compare them side by side, now that the full ground truth is public. It is the quickest way to see whether a rank difference comes from a handful of outliers or from a consistent edge across the test set.
The CYP inhibition challenge had great participation across the three tracks
Y’all worked incredibly hard! The challenge ran from mid-August to the 3rd of November and collected 6,034 submissions in total: 3,741 from Direct Inhibition, 1,695 from TDI, and 598 in the Structure track. Together, this totaled a whopping 13.8 million individual predictions! Submissions came from 650 accounts, of which only 291 were eligible participants; the rest were repeated “ghost” accounts from teams that didn’t follow the challenge rules.
Figure 3 shows submission rates climbed steadily through September, jumped around the interim leaderboard, and then increased faster through the final week, with 207 submissions (eligible for the final leaderboard) received on the last day alone. Most participants submitted multiple times, with a median of 3 valid submissions in Direct Inhibition, 2 in TDI, and 4 in Structure, while the most persistent of you submitted 116 times across the challenge.
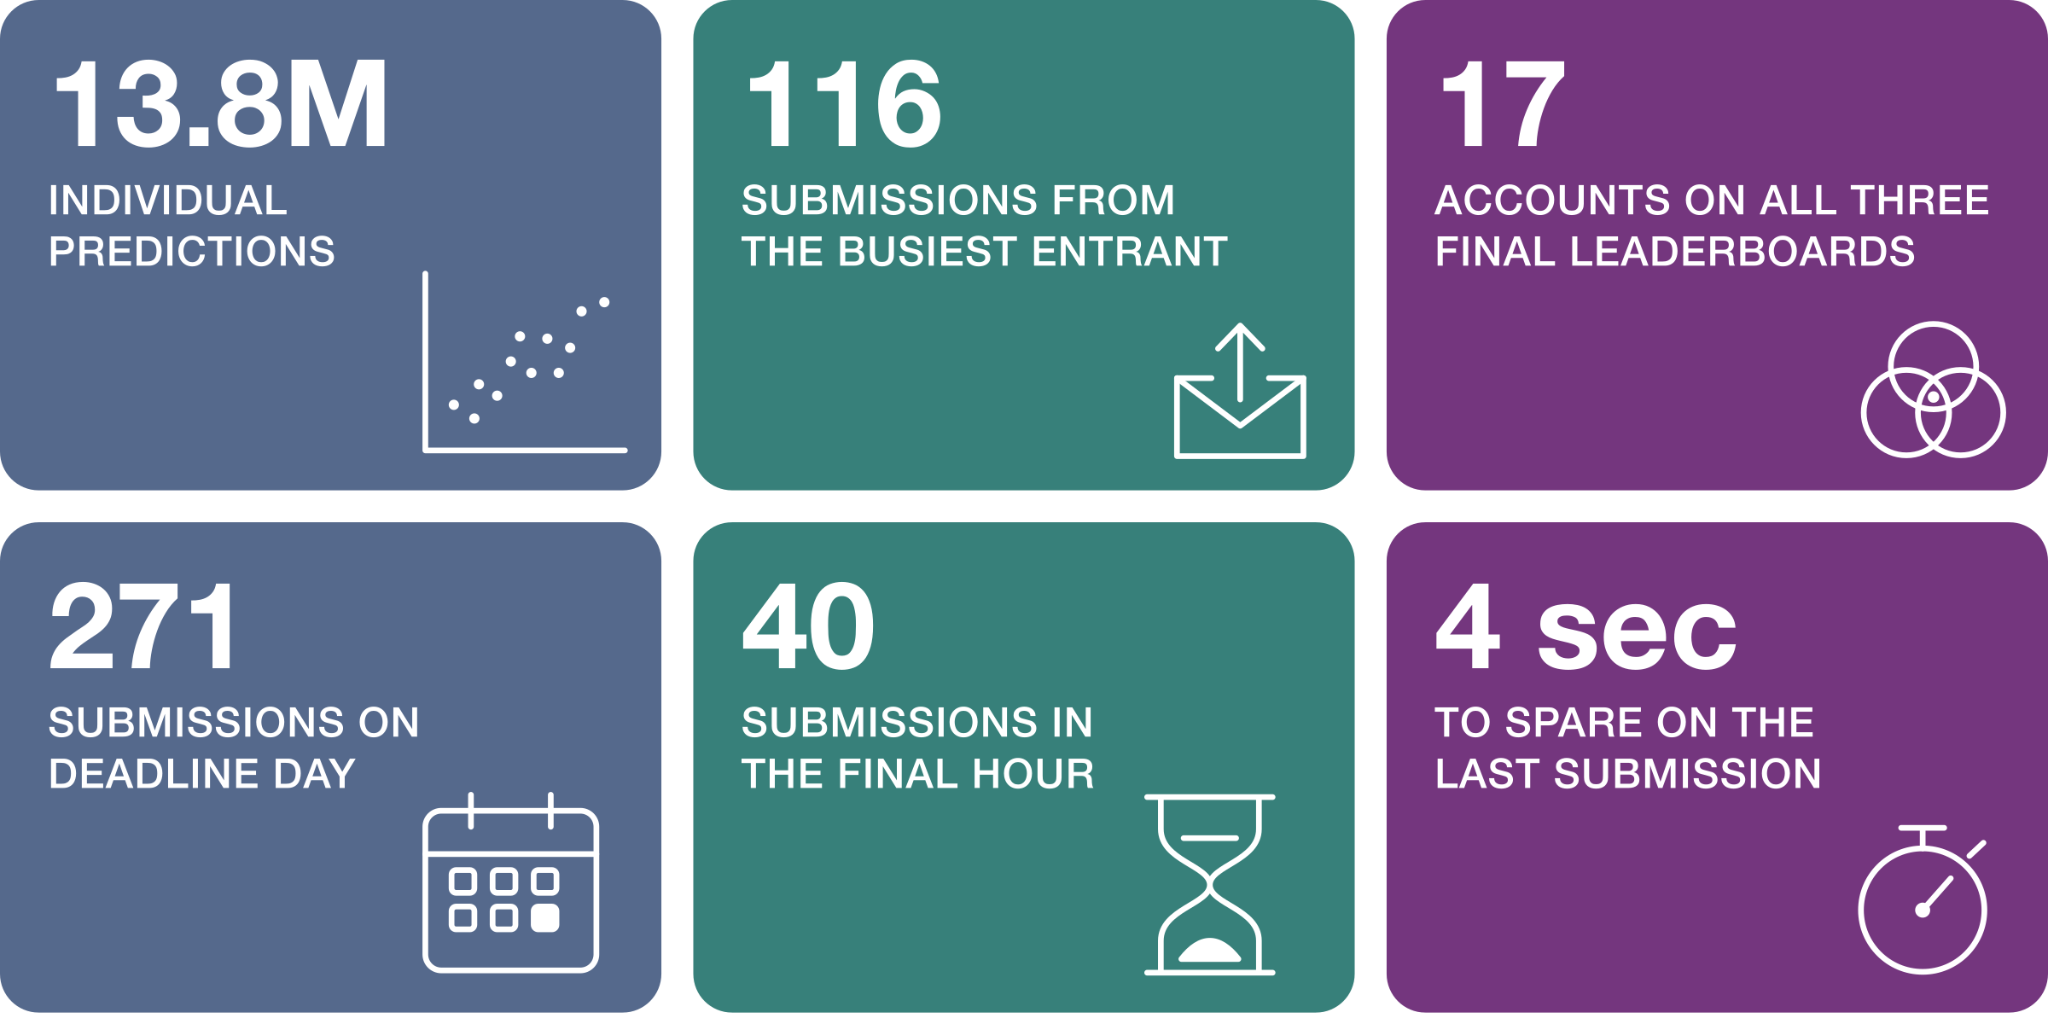
Plenty of you didn’t listen to us about not leaving your final submissions to the last minute. We received 271 submissions on the last day, 40 in the final hour, and one participant even submitted 4 seconds before the deadline (!!).
As always, these challenges wouldn't happen without you, our participants. Thank you for taking part, especially the 17 hard-working teams who appear on all three final leaderboards!
What’s next
The challenge may be officially over, but the fun is just getting started! Here is what you can look forward to in the coming weeks:
-
Unblinded dataset available now: The complete, unblinded dataset across all three tracks is officially live on Hugging Face!
-
Follow-up analysis & post-mortems: We’re diving deeper into the challenge results to extract key takeaways and performance trends across all three tracks, so stay tuned!
-
Webinars with the top participants: We'll host live webinars featuring the top-performing participants and teams, where you can hear directly about their modeling pipelines and lessons learned.
-
ML Innovation Award: In this challenge, we are also selecting a few submissions for the ML Innovation Award to highlight the competition's most creative approaches. The winners will be announced soon!
-
New OpenADMET Challenges: We’re far from done benchmarking ADMET prediction. Keep an eye out for the next challenge–it could launch as soon as next month!
Join our Discord channel and subscribe to our newsletter so you don't miss upcoming announcements and dataset releases!
Acknowledgements
We would like to thank our funders for their support of OpenADMET, in particular ARPA-H, Radial (part of the Astera Institute (https://ror.org/00ydx1s47)), Schrödinger Inc., the Gates Foundation and the OpenAI Foundation. We would also like to thank our partners Enamine, Hugging Face, OpenEye, CDD Vault, Discovery Life Sciences, and the beamline staff at NSLS-II for their support.
This work is supported by the Advanced Research Projects Agency for Health (ARPA-H) under AVOID-OME, and Award Number 1AY1AX000035. The contents are those of the authors. They may not reflect the policies of the Department of Health and Human Services or the U.S. government. The content is solely the responsibility of the authors and does not necessarily represent the official views of the Advanced Research Projects Agency for Health.